
July 27, 2026 a 11:44 am
CTSH: Fibonacci Analysis - Cognizant Technology Solutions Corporation
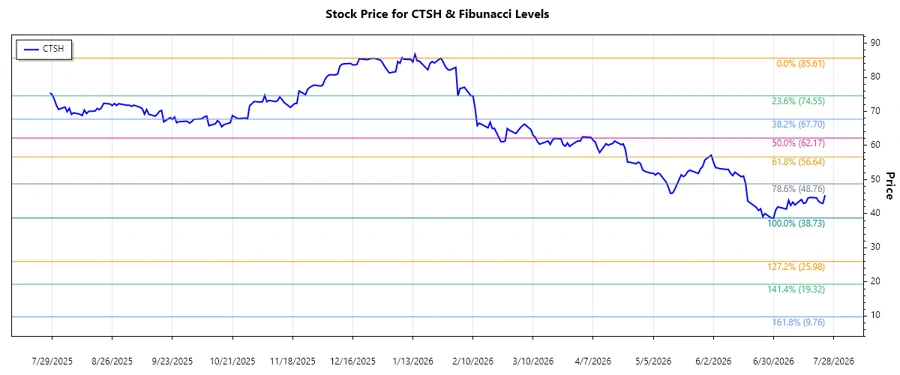
The stock of Cognizant Technology Solutions Corporation (CTSH) has seen significant fluctuations over recent months. Despite facing challenges in the broader professional services market, the company's diversified business segments have provided some resilience. Recent trends show a prevailing downward trajectory in the stock price, showcasing the challenges faced ahead. The technical analysis below provides an insight into key Fibonacci retracement levels that traders are eyeing for potential reversals or continuation signals.
Fibonacci Analysis
| Attributes | Details |
|---|---|
| Start Date of Trend | 2026-01-26 |
| End Date of Trend | 2026-07-24 |
| High Price | $85.61 (2026-01-26) |
| Low Price | $38.73 (2026-06-30) |
| Fibonacci Levels |
|
| Current Price | $45.45 |
| Retracement Zone | None (below 23.6%) |
| Technical Interpretation | The current price is below the 23.6% retracement level, indicating potential continued downward momentum. Traders might look for support at the lows or anticipate further declines. |
Conclusion
The Fibonacci analysis on CTSH reveals a persistent downtrend spanning from January to July 2026. The stock is trading below the critical 23.6% Fibonacci level, suggesting a challenging outlook. Such a position often leads analysts to be cautious, as it hints at possible further declines or consolidation at lower levels. The potential for a rebound exists if the stock can regain and sustain above these Fibonacci levels, but for now, the sentiment leans towards risk management. Opportunities may arise for investors with a long-term view anticipating a turnaround in Cognizant's strategic or operational execution. However, ongoing volatility in the tech industry may pose risks that require close monitoring.
Smart Data Insight
Master the Perfect Entry & Exit for this Stock
Don't leave your profits to chance. Historically, this stock follows specific seasonal patterns that institutional traders use to maximize returns.
- ✅ Identify the "Golden Buying Window"
- ✅ Avoid high-risk correction cycles
- ✅ Backtested data from the last 20+ years