
July 10, 2026 a 11:31 am

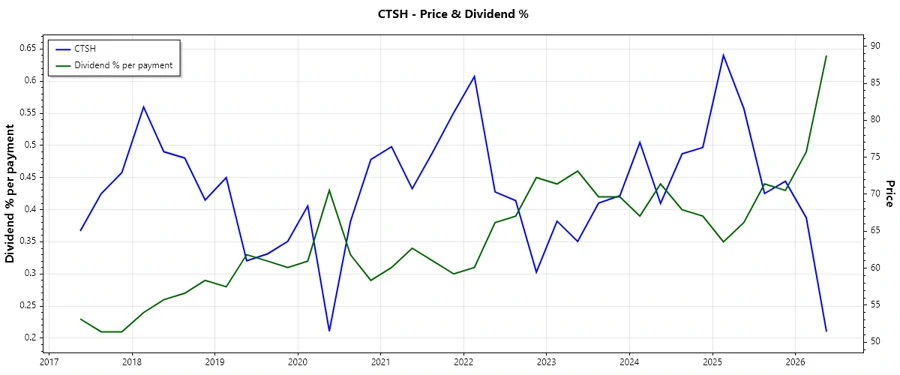


CTSH: Dividend Analysis - Cognizant Technology Solutions Corporation
Cognizant Technology Solutions Corporation demonstrates a stable dividend profile with consistent growth over the past years. The company’s dividend strategy suggests a commitment to returning value to shareholders while maintaining financial strength. With a reasonable payout ratio and a consistent dividend history, CTSH is well-positioned for continued dividend payments, appealing to income-focused investors. However, potential investors should consider the firm's broader financial health and market conditions.
📊 Overview
| Metric | Value |
|---|---|
| Sector | Information Technology |
| Dividend Yield | 2.49% |
| Current Dividend per Share | 1.27 USD |
| Dividend History | 10 years |
| Last Cut or Suspension | None |
🗣️ Dividend History
The historical track of dividends is crucial to assess a stock's reliability in providing shareholder returns. Cognizant has managed to sustain and slightly grow its dividends over the years, reflecting sound management strategies amidst market volatilities.
| Year | Dividend per Share (USD) |
|---|---|
| 2026 | 0.66 |
| 2025 | 1.24 |
| 2024 | 1.20 |
| 2023 | 1.16 |
| 2022 | 1.08 |
📈 Dividend Growth
Growth rates provide insights into how a company's dividends evolve over time, essential for dividend growth investors. Cognizant has shown moderate dividend increases, indicating underlying financial stability and potential for future hikes.
| Time | Growth |
|---|---|
| 3 years | 4.71% |
| 5 years | 7.10% |
The average dividend growth is 7.10% over 5 years. This shows moderate but steady dividend growth.
📉 Payout Ratio
The payout ratio is a key indicator of dividend sustainability. Cognizant’s EPS and FCF payout ratios reflect its capability to cover dividends without compromising financial health.
| Key figure | Ratio |
|---|---|
| EPS-based | 27.14% |
| Free cash flow-based | 24.33% |
With the EPS payout ratio at 27.14% and the FCF payout ratio at 24.33%, Cognizant shows a conservative approach in maintaining its payout efficiency, enhancing long-term dividend stability.
✅ Cashflow & Capital Efficiency
Examining cash flow metrics and capital efficiency guides investors in understanding corporate growth and sustainability. Cognizant showcases strong capital returns and a balanced cash flow strategy.
| Year | 2023 | 2024 | 2025 |
|---|---|---|---|
| Free Cash Flow Yield | 5.28% | 4.79% | 6.50% |
| Earnings Yield | 5.57% | 5.87% | 5.59% |
| CAPEX to Operating Cash Flow | 13.61% | 13.98% | 9.99% |
| Stock-based Compensation to Revenue | 0.91% | 0.89% | 0.86% |
| Free Cash Flow / Operating Cash Flow Ratio | 86.39% | 86.02% | 90.01% |
These figures suggest Cognizant’s efficient capital management and solid cash flow sustainability, vital for covering operational and investment activities.
⚠️ Balance Sheet & Leverage Analysis
Evaluating balance sheet metrics provides insights into a company's financial leverage and soundness. Cognizant maintains a prudent debt strategy and positive liquidity ratios, signaling robust financial health.
| Year | 2023 | 2024 | 2025 |
|---|---|---|---|
| Debt-to-Equity | 9.94% | 10.43% | 10.49% |
| Debt-to-Assets | 7.11% | 7.53% | 7.61% |
| Debt-to-Capital | 9.04% | 9.45% | 9.49% |
| Net Debt to EBITDA | -38.60% | -20.60% | -7.81% |
| Current Ratio | 2.25 | 2.09 | 2.34 |
| Quick Ratio | 2.25 | 2.09 | 2.34 |
| Financial Leverage | 1.40 | 1.39 | 1.38 |
Cognizant's low leverage ratios reflect a strong financial position, capable of meeting obligations and pursuing growth strategies.
Profitability & Fundamental Strength
Profitability indicators from equity and asset returns to margins elucidate a company's capacity to generate profits efficiently. Cognizant's metrics suggest solid profitability frameworks and robust operational efficiencies.
| Year | 2023 | 2024 | 2025 |
|---|---|---|---|
| Return on Equity | 16.07% | 15.55% | 14.85% |
| Return on Assets | 11.50% | 11.22% | 10.77% |
| Net Margin | 10.99% | 11.35% | 10.56% |
| EBIT Margin | 14.61% | 15.16% | 17.16% |
| EBITDA Margin | 17.48% | 17.91% | 19.77% |
| Gross Margin | 34.56% | 34.34% | 33.72% |
| R&D to Revenue | 0.00% | 0.00% | 0.00% |
Cognizant’s stable profits highlight effective cost management and strong market positioning. Continuous assessments may lead to opportunities for optimizing returns.
Price Development
➕ Dividend Scoring System
| Criteria | Description | Score |
|---|---|---|
| Dividend Yield | Consistent with industry standards | 3/5 |
| Dividend Stability | Solid history of payments | 4/5 |
| Dividend Growth | Steady growth observed | 3/5 |
| Payout Ratio | Conservatively managed | 4/5 |
| Financial Stability | Strong balance sheet | 4/5 |
| Dividend Continuity | No cuts or suspensions | 5/5 |
| Cashflow Coverage | Adequate to cover dividends | 4/5 |
| Balance Sheet Quality | Low leverage ratios | 4/5 |
Total Score: 31/40
🔍 Rating
Cognizant Technology Solutions Corporation offers a compelling option for dividend-focused investors due to their robust financial health and consistent dividend payouts. While the yield is modest, the firm's stability and strategic growth initiatives position it as a reliable investment. Investors should remain mindful of broader market dynamics and continue to evaluate earnings trajectories in relation to industry trends.
Smart Data Insight
Master the Perfect Entry & Exit for this Stock
Don't leave your profits to chance. Historically, this stock follows specific seasonal patterns that institutional traders use to maximize returns.
- ✅ Identify the "Golden Buying Window"
- ✅ Avoid high-risk correction cycles
- ✅ Backtested data from the last 20+ years