April 19, 2026 a 11:31 am

CTSH: Dividend Analysis - Cognizant Technology Solutions Corporation
Cognizant Technology Solutions Corporation presents a promising dividend profile with a consistent history of payouts over the past decade. The company's dividend yield stands at a modest yet stable level, complemented by a steady growth rate, indicating potential for long-term income generation. Its payout ratios suggest a healthy balance between rewarding shareholders and retaining earnings for growth, reflecting prudent financial management.
📊 Overview
Analyzing Cognizant’s dividend metrics provides insight into its financial health and shareholder strategy, and this assessment reveals a commitment to stable and growing dividends within its sector.
| Parameter | Value |
|---|---|
| Sector | Technology |
| Dividend yield | 1.89 % |
| Current dividend per share | 1.27 USD |
| Dividend history | 10 years |
| Last cut or suspension | None |
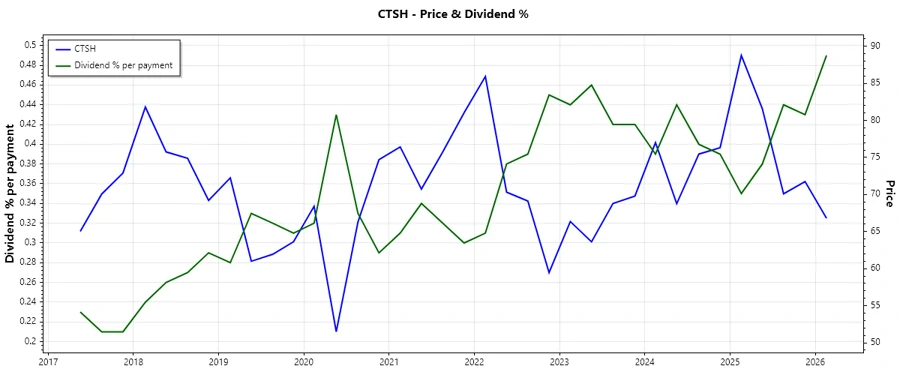
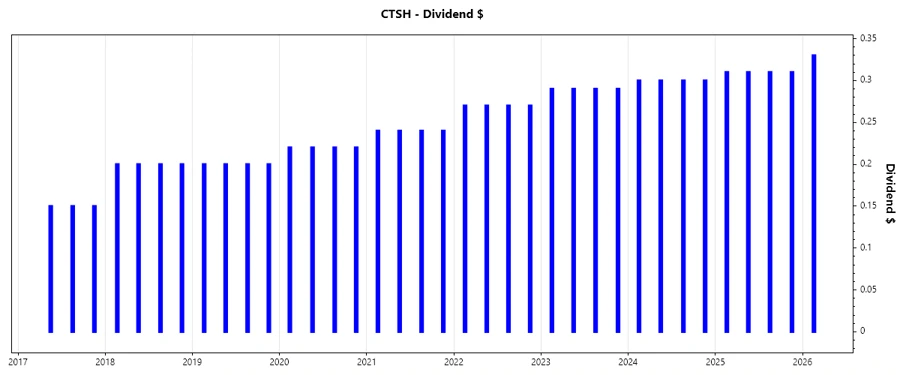
🗣️ Dividend History
The dividend history is significant as it showcases Cognizant's reliability in returning cash to its shareholders. A robust dividend history often translates to investor confidence and market stability.
| Year | Dividend per Share (USD) |
|---|---|
| 2026 | 0.33 |
| 2025 | 1.24 |
| 2024 | 1.20 |
| 2023 | 1.16 |
| 2022 | 1.08 |
📈 Dividend Growth
Dividend growth rates are a crucial indicator of the company’s future ability to maintain and increase payouts. It reflects profitability and cash flow dynamics.
| Time | Growth |
|---|---|
| 3 years | 4.71 % |
| 5 years | 7.10 % |
The average dividend growth is 7.10 % over 5 years. This shows moderate but steady dividend growth.
✅ Payout Ratio
The payout ratio indicates how much of the earnings are distributed as dividends, providing insight into dividend sustainability and coverage.
| Key figure | Ratio |
|---|---|
| EPS-based | 27.35 % |
| Free cash flow-based | 23.59 % |
The EPS payout ratio of 27.35 % and FCF payout ratio of 23.59 % suggest a conservative approach, allowing room for maintaining dividends even amidst potential earnings fluctuations.
📉 Cashflow & Capital Efficiency
Cash flow and capital efficiency ratios assess the company’s ability to generate cash relative to its earnings and expenses, highlighting financial health and operational efficiency.
| Metric | 2023 | 2024 | 2025 |
|---|---|---|---|
| Free Cash Flow Yield | 5.28 % | 4.79 % | 6.50 % |
| Earnings Yield | 5.57 % | 5.87 % | 5.59 % |
| CAPEX to Operating Cash Flow | 13.61 % | 13.98 % | 9.99 % |
| Stock-based Compensation to Revenue | 0.86 % | 0 % | 0.86 % |
| Free Cash Flow / Operating Cash Flow Ratio | 86.39 % | 86.02 % | 90.01 % |
The data indicate a stable cash flow generation capability, underscored by the strong Free Cash Flow to Operating Cash Flow ratios. Capital efficiency readings support long-term operational sustainability.
⚠️ Balance Sheet & Leverage Analysis
These indicators evaluate the firm's debt levels, liquidity, and financial leverage, essential for assessing financial risk and capital structure.
| Metric | 2023 | 2024 | 2025 |
|---|---|---|---|
| Debt-to-Equity | 0.099 | 0.104 | 0.104 |
| Debt-to-Assets | 0.071 | 0.075 | 0.076 |
| Debt-to-Capital | 0.090 | 0.094 | 0.095 |
| Net Debt to EBITDA | -0.386 | -0.206 | -0.078 |
| Current Ratio | 2.252 | 2.093 | 2.337 |
| Quick Ratio | 2.252 | 2.093 | 2.337 |
| Financial Leverage | 1.397 | 1.386 | 1.378 |
The company maintains a strong balance sheet characterized by low leverage and high liquidity, supporting financial flexibility and highlighting minimal dependency on debt for capital needs.
✅ Fundamental Strength & Profitability
These metrics portray operational efficiency and profitability, essential for evaluating investment returns and the company's competitive positioning.
| Metric | 2023 | 2024 | 2025 |
|---|---|---|---|
| Return on Equity | 16.07 % | 15.55 % | 14.85 % |
| Return on Assets | 11.50 % | 11.22 % | 10.78 % |
| Net Margin | 10.99 % | 11.35 % | 10.56 % |
| EBIT Margin | 14.61 % | 15.16 % | 17.16 % |
| EBITDA Margin | 17.48 % | 17.91 % | 19.77 % |
| Gross Margin | 34.56 % | 34.34 % | 33.72 % |
| R&D to Revenue | 0 % | 0 % | 0 % |
The company's profitability and operational efficiency are strong, as indicated by robust ROE and consistent margins, which underscore competitive advantages and sustainable growth potential.
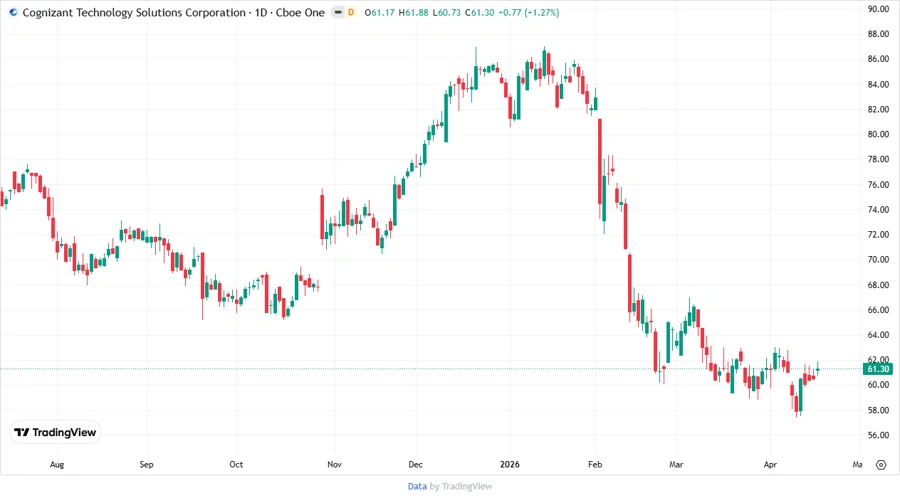
📈 Price Development
🗳️ Dividend Scoring System
| Criteria | Score | |
|---|---|---|
| Dividend yield | 3 | |
| Dividend Stability | 4 | |
| Dividend growth | 3 | |
| Payout ratio | 5 | |
| Financial stability | 5 | |
| Dividend continuity | 4 | |
| Cashflow Coverage | 4 | |
| Balance Sheet Quality | 5 |
Total Score: 33/40
📊 Rating
Cognizant Technology Solutions Corporation exhibits strong fundamentals and a commendable dividend profile. The company's financial stability, efficient capital management, and commitment to returning value to shareholders through consistent dividends make it an attractive option for dividend-oriented investors. Its prudent financial management assures sustainability and resilience against economic fluctuations. Potential investors may consider this stock as a robust addition to a diversified portfolio focused on dividend income and capital appreciation.
Smart Data Insight
Master the Perfect Entry & Exit for this Stock
Don't leave your profits to chance. Historically, this stock follows specific seasonal patterns that institutional traders use to maximize returns.
- ✅ Identify the "Golden Buying Window"
- ✅ Avoid high-risk correction cycles
- ✅ Backtested data from the last 20+ years