August 11, 2025 a 02:46 am


CTSH: Dividend Analysis - Cognizant Technology Solutions Corporation
Cognizant Technology Solutions Corporation (CTSH) presents an interesting dividend profile with a moderate yield and a history of consistent payments. While the current yield stands at approximately 1.77%, the company has shown potential for steady dividend growth, reflecting a commitment to returning capital to shareholders. The financial metrics suggest strong coverage of dividends through earnings and free cash flow, providing a solid ground for continued stability.
📊 Overview
CTSH operates within the technology sector, a domain known for dynamic innovation and growth potential.
| Metric | Value |
|---|---|
| Sector | Technology |
| Dividend yield | 1.77 % |
| Current dividend per share | 1.21 USD |
| Dividend history | 9 years |
| Last cut or suspension | None |
📈 Dividend History
With a 9-year dividend history, CTSH maintains a stable pattern of dividend growth, crucial for income-focused investors.
| Year | Dividend Per Share (USD) |
|---|---|
| 2025 | 0.93 |
| 2024 | 1.20 |
| 2023 | 1.16 |
| 2022 | 1.08 |
| 2021 | 0.96 |
📊 Dividend Growth
Dividend growth is a key indicator of a company's financial health and shareholder commitment. CTSH has managed to grow dividends over the years, suggesting financial resilience.
| Time | Growth |
|---|---|
| 3 years | 7.72 % |
| 5 years | 8.45 % |
The average dividend growth is 8.45 % over 5 years. This shows moderate but steady dividend growth.
📈 Payout Ratio
The payout ratio indicates how much of a company's earnings are paid out as dividends. A balanced payout ratio signals a healthy balance between rewarding shareholders and retaining earnings for growth.
| Key figure | Ratio |
|---|---|
| EPS-based | 24.43 % |
| Free cash flow-based | 25.89 % |
The low EPS and FCF payout ratios are indicative of excellent dividend coverage, implying potential for future dividend increases.
📊 Cashflow & Capital Efficiency
An efficient cash flow and capital utilization are vital for sustaining operations and funding dividends.
| Year | 2024 | 2023 | 2022 |
|---|---|---|---|
| Free Cash Flow Yield | 4.79 % | 5.28 % | 7.55 % |
| Earnings Yield | 5.87 % | 5.57 % | 7.73 % |
| CAPEX to Operating Cash Flow | 13.98 % | 13.61 % | 12.93 % |
| Stock-based Compensation to Revenue | 0.89 % | 0.91 % | 1.34 % |
| Free Cash Flow / Operating Cash Flow Ratio | 86.02 % | 86.39 % | 87.07 % |
CTSH shows strong cash flow ratios, suggesting efficient capital allocation strategies and income stability.
📊 Balance Sheet & Leverage Analysis
An analysis of the balance sheet gives insight into a company's financial health and its ability to meet obligations.
| Year | 2024 | 2023 | 2022 |
|---|---|---|---|
| Debt-to-Equity | 0.10 | 0.10 | 0.12 |
| Debt-to-Assets | 0.08 | 0.07 | 0.09 |
| Debt-to-Capital | 0.09 | 0.09 | 0.11 |
| Net Debt to EBITDA | -0.21 | -0.39 | -0.18 |
| Current Ratio | 2.09 | 2.25 | 2.17 |
| Quick Ratio | 2.09 | 2.25 | 2.17 |
| Financial Leverage | 1.39 | 1.40 | 1.45 |
CTSH demonstrates low leverage with impressive liquidity ratios, providing a buffer against financial cycles.
📊 Fundamental Strength & Profitability
Understanding a company's profitability and efficiency is paramount for potential investors focused on long-term growth.
| Year | 2024 | 2023 | 2022 |
|---|---|---|---|
| Return on Equity | 15.55 % | 16.07 % | 18.60 % |
| Return on Assets | 11.22 % | 11.50 % | 12.83 % |
| Net Margin | 11.35 % | 10.99 % | 11.83 % |
| EBIT Margin | 15.16 % | 14.61 % | 15.62 % |
| EBITDA Margin | 17.84 % | 17.29 % | 18.55 % |
| Gross Margin | 34.34 % | 34.56 % | 35.93 % |
| R&D to Revenue | 0.00 % | 0.00 % | 0.00 % |
CTSH boasts strong profitability metrics, underpinned by efficient cost management and a robust operating model.
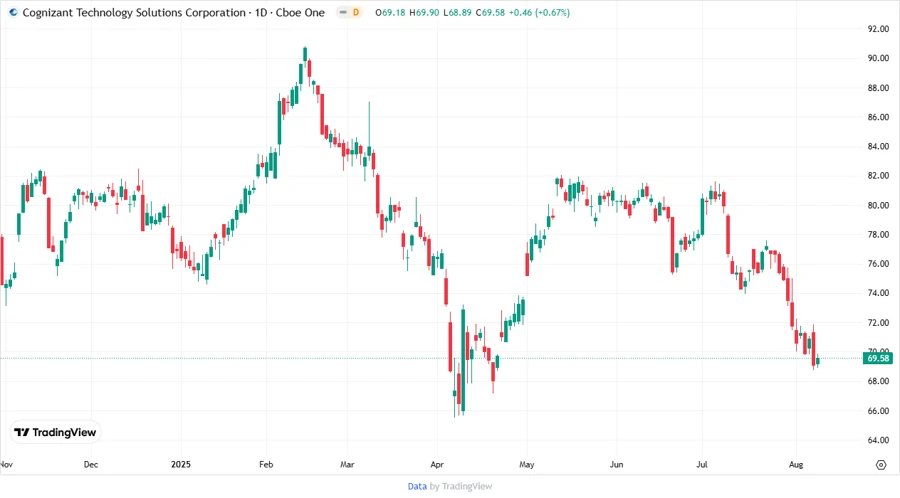
📈 Price Development
📊 Dividend Scoring System
| Category | Score | Bar | |
|---|---|---|---|
| Dividend yield | 3 | ||
| Dividend Stability | 4 | ||
| Dividend growth | 3 | ||
| Payout ratio | 4 | ||
| Financial stability | 5 | ||
| Dividend continuity | 3 | ||
| Cashflow Coverage | 4 | ||
| Balance Sheet Quality | 5 | ||
Overall Score: 31/40
✅ Rating
CTSH is a robust choice for dividend investors seeking a combination of stability and moderate growth. Its strong fundamentals, coupled with responsible payout ratios, suggest that it can maintain its dividend commitments with relative ease. However, investors should consider potential market risks associated with the technology sector, while remaining confident in CTSH's strategic financial management and capital efficiency.
Smart Data Insight
Master the Perfect Entry & Exit for this Stock
Don't leave your profits to chance. Historically, this stock follows specific seasonal patterns that institutional traders use to maximize returns.
- ✅ Identify the "Golden Buying Window"
- ✅ Avoid high-risk correction cycles
- ✅ Backtested data from the last 20+ years