June 04, 2025 a 12:46 pm

CTSH: Dividend Analysis - Cognizant Technology Solutions Corporation
The dividend profile of Cognizant Technology Solutions Corporation reveals a stable and progressively growing return to shareholders. With a dividend yield of approximately 1.50%, the company offers a reasonable income stream for investors prioritizing dividend income. Despite the 9-year dividend history, including no recent cuts or suspensions, the payout ratios indicate a sustainable dividend policy supported by solid earnings and free cash flow. These attributes make CTSH a compelling choice for conservatives seeking growth and income.
📊 Overview
Cognizant operates within the Information Technology sector, offering investors a dividend yield of 1.50%. With a stable dividend per share of $1.21 and a consistent payout history of 9 years, the risk of recent suspension is negligible. The lack of any recent dividend cuts underscores the firm's commitment to returning value to shareholders.
| Metric | Details |
|---|---|
| Sector | Information Technology |
| Dividend Yield | 1.50% |
| Current Dividend per Share | 1.21 USD |
| Dividend History | 9 years |
| Last Cut or Suspension | None |
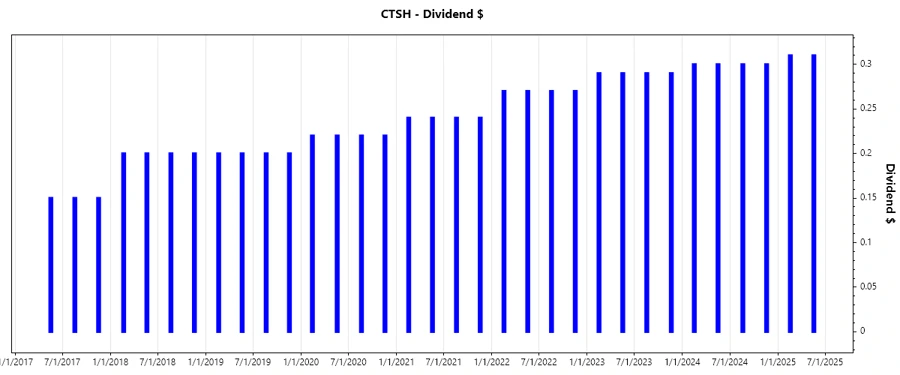
🗣️ Dividend History
The company has consistently rewarded shareholders with dividends over the past 9 years. This payout history reflects management’s focus on sustained return of capital, and mitigates concerns regarding future cuts or suspensions. Such consistency is crucial for income-seeking investors as it provides a steady income stream.
| Year | Dividend per Share (USD) |
|---|---|
| 2025 | 0.62 |
| 2024 | 1.20 |
| 2023 | 1.16 |
| 2022 | 1.08 |
| 2021 | 0.96 |
📈 Dividend Growth
The growth of Cognizant's dividend emphasizes their capacity to increase shareholder value. Over the last 3 years, dividends have grown by 7.7%, while a 5-year growth rate stands at 8.4%. Such growth rates demonstrate the company's commitment to simultaneously rewarding its shareholders and sustaining internal reinvestment.
| Time | Growth |
|---|---|
| 3 years | 7.72% |
| 5 years | 8.45% |
The average dividend growth is 8.45% over 5 years. This shows moderate but steady dividend growth.
✅ Payout Ratio
The payout ratios indicate room to maintain or increase dividends in the future. An EPS-based payout ratio of 25.35% and a free cash flow-based payout ratio of 27.94% suggest healthy retention of earnings for further growth or debt reduction.
| Key Figure | Ratio |
|---|---|
| EPS-based | 25.35% |
| Free Cash Flow-based | 27.94% |
The conservative EPS payout ratio of 25.35% and FCF payout ratio of 27.94% reflect a disciplined approach, ensuring dividends are well-covered by both earnings and cash flows.
💰 Cashflow & Capital Efficiency
The analysis of cash flow and capital efficiency underscores the company's operational efficiency. Key ratios like the Free Cash Flow/Operating Cash Flow ratio of 0.86 demonstrate effective cash utilization.
| Year | FCF Yield | CAPEX/Operating CF | Stock Comp/Revenue | FCF/Operating CF Ratio |
|---|---|---|---|---|
| 2024 | 4.79% | 13.98% | 0.89% | 86.02% |
| 2023 | 5.28% | 13.61% | 0.91% | 86.39% |
| 2022 | 7.55% | 12.93% | 1.34% | 87.07% |
Throughout the examined period, Cognizant maintains robust cash flow generation and capital efficiency, indicated by the stable Free Cash Flow/Operating Cash Flow ratios.
🧾 Balance Sheet & Leverage Analysis
The company's balance sheet is strong, reflecting low leverage and high liquidity. Cognizant's Debt-to-Equity ratio of approximately 0.10 underscores minimal reliance on debt financing, supported by solid interest coverage ratios.
| Year | Debt/Equity | Debt/Assets | Net Debt/EBITDA | Current Ratio | Quick Ratio |
|---|---|---|---|---|---|
| 2024 | 0.10 | 0.07 | -0.21 | 2.09 | 2.09 |
| 2023 | 0.10 | 0.07 | -0.39 | 2.25 | 2.25 |
| 2022 | 0.12 | 0.09 | -0.18 | 2.17 | 2.17 |
A stable Debt-to-Equity ratio and improving liquidity indicate excellent financial health and low risk in meeting short and long-term obligations.
🌟 Fundamental Strength & Profitability
Cognizant’s profitability is reaffirmed by solid return metrics and healthy margins. Return on Equity consistently exceeds 15%, while net profit margins underscore efficient cost management.
| Year | ROE | Net Margin | EBIT Margin | R&D/Revenue |
|---|---|---|---|---|
| 2024 | 15.55% | 11.35% | 15.16% | 0% |
| 2023 | 16.07% | 10.99% | 14.61% | 0% |
| 2022 | 18.60% | 11.79% | 15.62% | 0% |
High profitability margins signify strong operational effectiveness, while high returns on equity and assets reinforce the company's value creation capabilities.
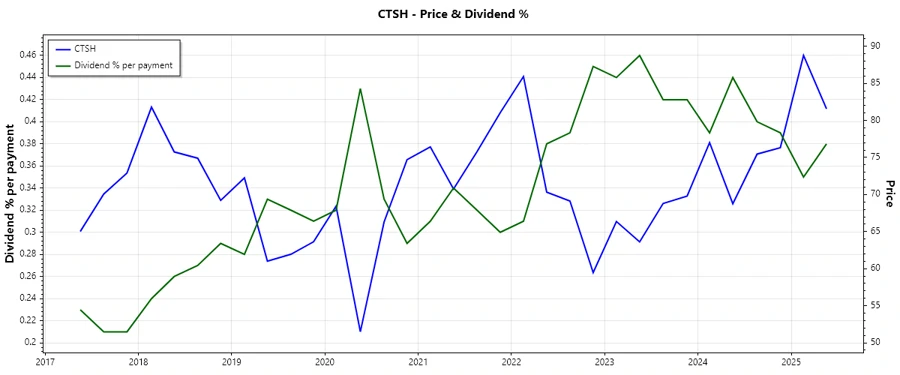
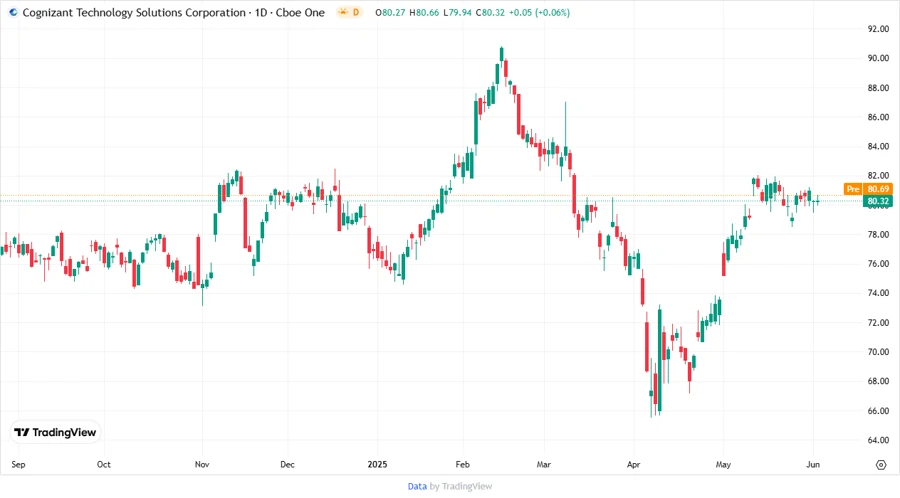
📉 Price Development
🏅 Dividend Scoring System
| Criteria | Score | Visual |
|---|---|---|
| Dividend yield | 4 | |
| Dividend Stability | 5 | |
| Dividend growth | 4 | |
| Payout ratio | 5 | |
| Financial stability | 5 | |
| Dividend continuity | 5 | |
| Cashflow Coverage | 5 | |
| Balance Sheet Quality | 5 |
Overall Score: 38/40
🔍 Rating
Based on the comprehensive analysis, Cognizant Technology Solutions Corporation demonstrates a robust dividend profile, marked by stability and growth. Its financial metrics suggest an excellent balance between reinvestment in the business and rewarding shareholders, rendering it a solid potential investment for those seeking consistent dividend income with growth prospects. Highly recommended for a balanced portfolio.
Smart Data Insight
Master the Perfect Entry & Exit for this Stock
Don't leave your profits to chance. Historically, this stock follows specific seasonal patterns that institutional traders use to maximize returns.
- ✅ Identify the "Golden Buying Window"
- ✅ Avoid high-risk correction cycles
- ✅ Backtested data from the last 20+ years