AXP: Dividend Analysis - American Express Company

AXP: In-depth analysis of a company's dividend stability and key fundamental ratios to assess its financial strength and long-term investment potential.
July 18, 2026 a 03:31 am
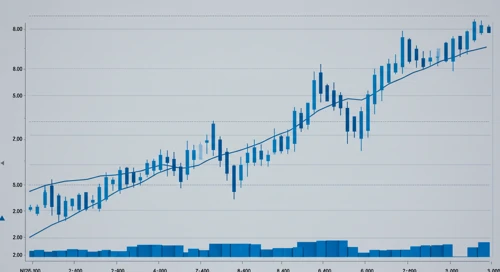
HOOD: Trend with Support and Resistance Levels - Robinhood Markets Inc
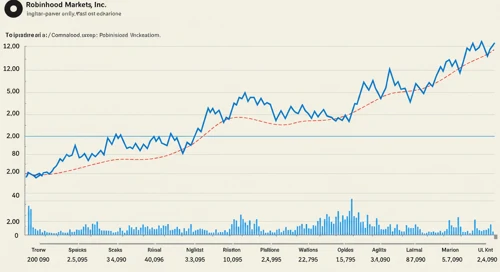
HOOD: Current price trend is evaluated alongside key support and resistance level. View of potential turning points and price momentum.
July 18, 2026 a 03:15 am
FDX: Dividend Analysis - FedEx Corporation
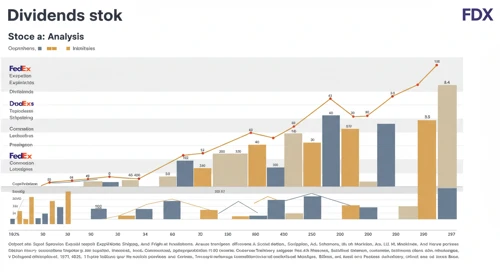
FDX: In-depth analysis of a company's dividend stability and key fundamental ratios to assess its financial strength and long-term investment potential.
July 18, 2026 a 02:46 am
Todays Important Key Figures 18 Jul
Today’s important economic data releases – a snapshot of key indicators influencing markets and shaping financial expectations.
July 17, 2026 a 11:00 pm
TRV: Analysts Ratings - The Travelers Companies Inc
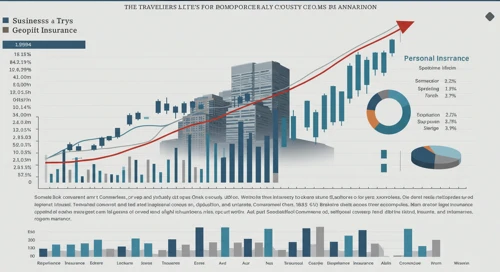
TRV: Comprehensive breakdown of current and historical analyst ratings, offering insights into how expert sentiment has evolved over time.
July 17, 2026 a 09:00 pm
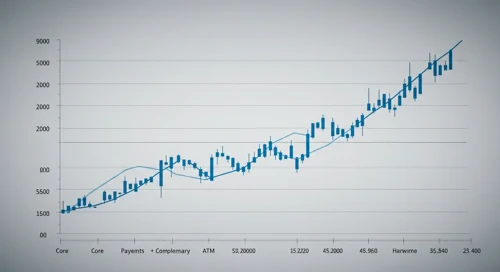
FI: Analysts Ratings - Fiserv Inc
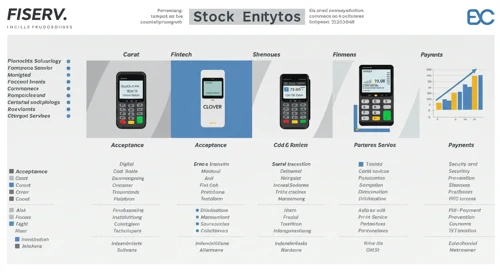
FI: Comprehensive breakdown of current and historical analyst ratings, offering insights into how expert sentiment has evolved over time.
July 17, 2026 a 08:38 pm
ZBRA: Fundamental Ratio Analysis - Zebra Technologies Corporation
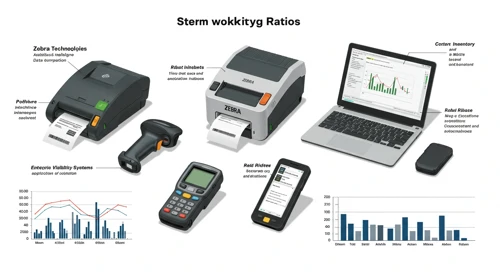
ZBRA: Evaluation of key financial ratios, analyst ratings, and price targets. A data-driven perspective on the valuation and market expectations.
July 17, 2026 a 07:43 pm
JKHY: Fibunacci Level Technical Analysis - Jack Henry and Associates Inc
July 18, 2026 a 05:15 am
GBPCAD: Fibunacci Level Technical Analysis
July 18, 2026 a 05:08 am
NZDCAD: Trend with Support and Resistance Levels
July 18, 2026 a 04:28 am

CCL: Trend with Support and Resistance Levels - Carnival Corporation and plc
July 18, 2026 a 04:03 am
Todays Important Key Figures 17 Jul

Today’s important economic data releases – a snapshot of key indicators influencing markets and shaping financial expectations.
July 17, 2026 a 07:00 pm
SLB: Fundamental Ratio Analysis - Slb NV
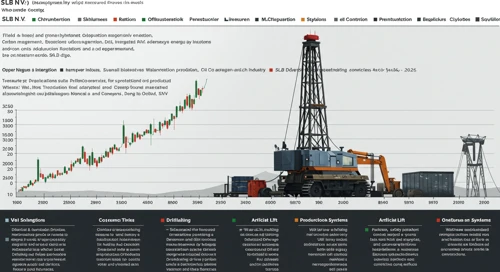
SLB: Evaluation of key financial ratios, analyst ratings, and price targets. A data-driven perspective on the valuation and market expectations.
July 17, 2026 a 06:00 pm
CSX: Analysts Ratings - CSX Corporation
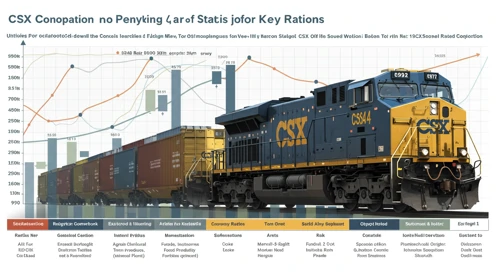
CSX: Comprehensive breakdown of current and historical analyst ratings, offering insights into how expert sentiment has evolved over time.
July 17, 2026 a 05:00 pm
UHS: Fibunacci Level Technical Analysis - Universal Health Services Inc
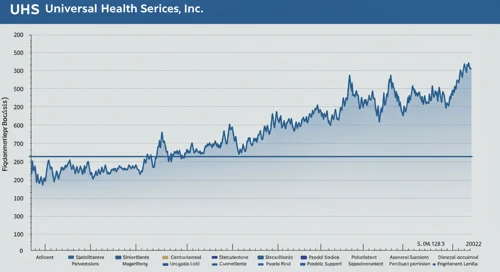
UHS: Fibonacci retracement levels to identify key potential support and resistance zones, based on recent price trends.
July 17, 2026 a 04:44 pm
CLX: Analysts Ratings - The Clorox Company
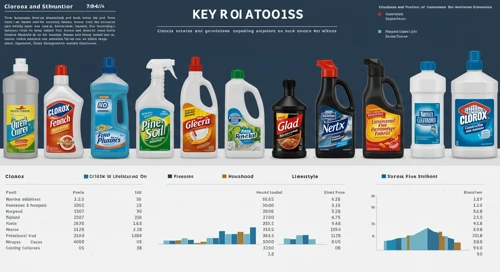
CLX: Comprehensive breakdown of current and historical analyst ratings, offering insights into how expert sentiment has evolved over time.
July 17, 2026 a 04:38 pm
ERIE: Fundamental Ratio Analysis - Erie Indemnity Company

ERIE: Evaluation of key financial ratios, analyst ratings, and price targets. A data-driven perspective on the valuation and market expectations.
July 17, 2026 a 03:43 pm
Europe Comparison. 17 Jul
Comparison of Europe. Where is strength and weakness? What has developed well and badly?
July 17, 2026 a 03:31 pm
Stock Market - Heatmap
Use mouse wheel to zoom in and out. Click a ticker to display detailed information in a new window. Hover mouse cursor over a ticker to see more data.
Stock's
HAS: Analysts Ratings - Hasbro Inc
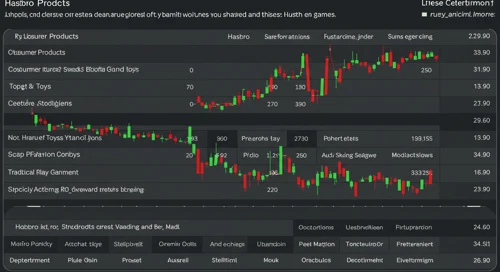
HAS: Comprehensive breakdown of current and historical analyst ratings, offering insights into how expert sentiment has evolved over time.
July 17, 2026 a 01:00 pm
NDAQ: Dividend Analysis - Nasdaq Inc

NDAQ: In-depth analysis of a company's dividend stability and key fundamental ratios to assess its financial strength and long-term investment potential.
July 17, 2026 a 12:46 pm
WDAY: Analysts Ratings - Workday Inc
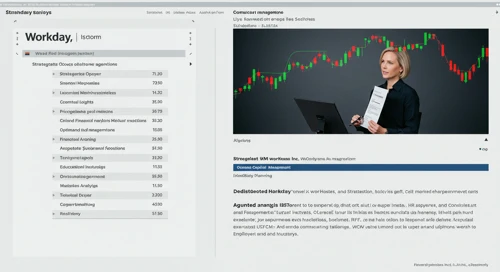
WDAY: Comprehensive breakdown of current and historical analyst ratings, offering insights into how expert sentiment has evolved over time.
July 17, 2026 a 12:38 pm
CRH: Fibunacci Level Technical Analysis - CRH plc
CRH: Fibonacci retracement levels to identify key potential support and resistance zones, based on recent price trends.
July 17, 2026 a 11:44 am
APD: Fundamental Ratio Analysis - Air Products and Chemicals Inc
APD: Evaluation of key financial ratios, analyst ratings, and price targets. A data-driven perspective on the valuation and market expectations.
July 17, 2026 a 11:43 am
NTAP: Dividend Analysis - NetApp Inc
NTAP: In-depth analysis of a company's dividend stability and key fundamental ratios to assess its financial strength and long-term investment potential.
July 17, 2026 a 11:31 am
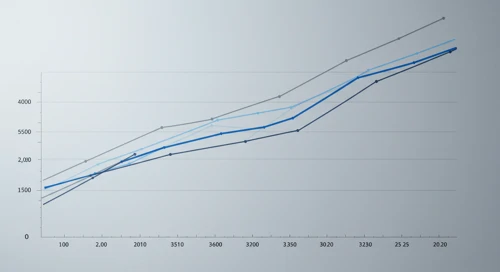
APD: Fibunacci Level Technical Analysis - Air Products and Chemicals Inc
APD: Fibonacci retracement levels to identify key potential support and resistance zones, based on recent price trends.
July 17, 2026 a 10:15 am
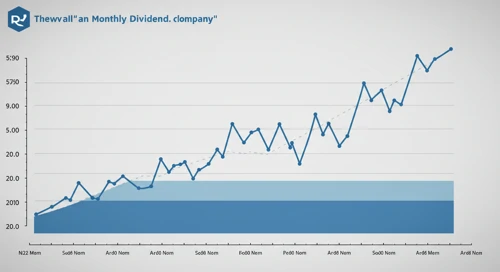
O: Fibunacci Level Technical Analysis - Realty Income Corporation
July 17, 2026 a 03:15 pm

DECK: Trend with Support and Resistance Levels - Deckers Outdoor Corporation
July 17, 2026 a 02:03 pm

CARR: Trend with Support and Resistance Levels - Carrier Global Corporation
July 17, 2026 a 01:15 pm
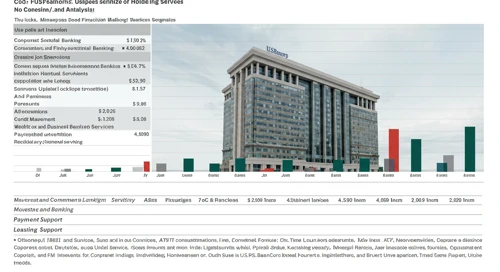
USB: Fundamental Ratio Analysis - US Bancorp
July 17, 2026 a 01:00 pm
RCL: Trend with Support and Resistance Levels - Royal Caribbean Cruises Ltd

RCL: Current price trend is evaluated alongside key support and resistance level. View of potential turning points and price momentum.
July 17, 2026 a 09:03 am
REGN: Analysts Ratings - Regeneron Pharmaceuticals Inc
REGN: Comprehensive breakdown of current and historical analyst ratings, offering insights into how expert sentiment has evolved over time.
July 17, 2026 a 09:00 am
DVA: Analysts Ratings - DaVita Inc
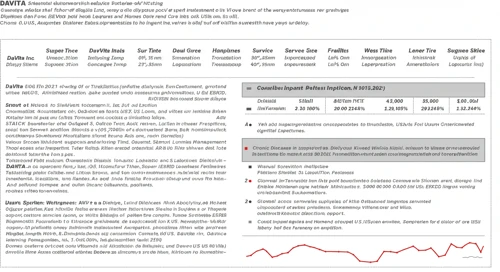
DVA: Comprehensive breakdown of current and historical analyst ratings, offering insights into how expert sentiment has evolved over time.
July 17, 2026 a 08:38 am
AVY: Fundamental Ratio Analysis - Avery Dennison Corporation

AVY: Evaluation of key financial ratios, analyst ratings, and price targets. A data-driven perspective on the valuation and market expectations.
July 17, 2026 a 08:00 am
NEM: Dividend Analysis - Newmont Corporation
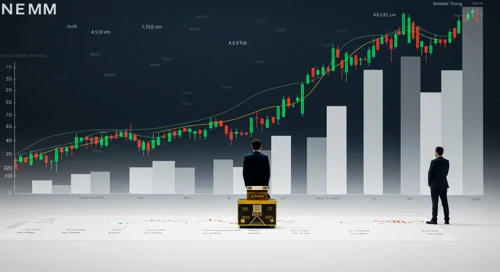
NEM: In-depth analysis of a company's dividend stability and key fundamental ratios to assess its financial strength and long-term investment potential.
July 17, 2026 a 07:46 am
WSM: Fundamental Ratio Analysis - Williams Sonoma Inc

WSM: Evaluation of key financial ratios, analyst ratings, and price targets. A data-driven perspective on the valuation and market expectations.
July 17, 2026 a 07:43 am
FTV: Dividend Analysis - Fortive Corporation
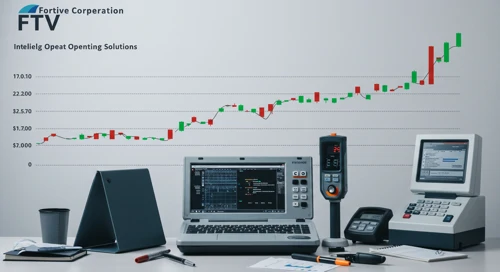
FTV: In-depth analysis of a company's dividend stability and key fundamental ratios to assess its financial strength and long-term investment potential.
July 17, 2026 a 07:30 am
Economic Calendar
Currencies
EURAUD: Trend with Support and Resistance Levels
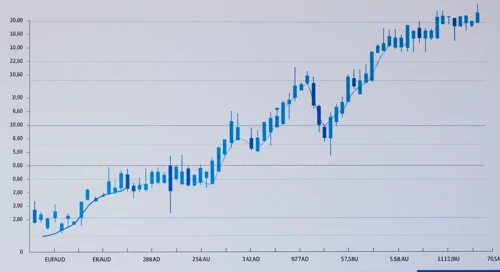
EURAUD: Current price trend is evaluated alongside key support and resistance level. View of potential turning points and price momentum.
July 16, 2026 a 04:28 am
Important Key Figures of the last Days

Overview of key economic indicators released over the past days, highlighting their potential impact on markets and investor sentiment.
July 16, 2026 a 02:31 am
Todays Important Key Figures 15 Jul

Today’s important economic data releases – a snapshot of key indicators influencing markets and shaping financial expectations.
July 15, 2026 a 07:00 pm
CADCHF: Fibunacci Level Technical Analysis
CADCHF: Fibonacci retracement levels to identify key potential support and resistance zones, based on recent price trends.
July 15, 2026 a 05:08 am
GBPSEK: Trend with Support and Resistance Levels
GBPSEK: Current price trend is evaluated alongside key support and resistance level. View of potential turning points and price momentum.
July 15, 2026 a 04:28 am
Todays Important Key Figures 14 Jul

Today’s important economic data releases – a snapshot of key indicators influencing markets and shaping financial expectations.
July 14, 2026 a 07:00 pm
GBPCHF: Fibunacci Level Technical Analysis
GBPCHF: Fibonacci retracement levels to identify key potential support and resistance zones, based on recent price trends.
July 14, 2026 a 05:08 am
GBPUSD: Fibunacci Level Technical Analysis
July 17, 2026 a 05:08 am
CHFJPY: Trend with Support and Resistance Levels
July 17, 2026 a 04:28 am
Todays Important Key Figures 16 Jul
July 16, 2026 a 07:00 pm
CADJPY: Fibunacci Level Technical Analysis
July 16, 2026 a 05:08 am
USDCHF: Trend with Support and Resistance Levels
USDCHF: Current price trend is evaluated alongside key support and resistance level. View of potential turning points and price momentum.
July 14, 2026 a 04:28 am
Important Key Figures of the last Days

Overview of key economic indicators released over the past days, highlighting their potential impact on markets and investor sentiment.
July 14, 2026 a 02:31 am
Todays Important Key Figures 13 Jul
Today’s important economic data releases – a snapshot of key indicators influencing markets and shaping financial expectations.
July 13, 2026 a 07:00 pm
EURCHF: Fibunacci Level Technical Analysis
EURCHF: Fibonacci retracement levels to identify key potential support and resistance zones, based on recent price trends.
July 13, 2026 a 05:08 am
AUDUSD: Fibunacci Level Technical Analysis

AUDUSD: Fibonacci retracement levels to identify key potential support and resistance zones, based on recent price trends.
July 12, 2026 a 05:08 am
EURUSD: Trend with Support and Resistance Levels
EURUSD: Current price trend is evaluated alongside key support and resistance level. View of potential turning points and price momentum.
July 12, 2026 a 04:28 am
NZDCHF: Fibunacci Level Technical Analysis
NZDCHF: Fibonacci retracement levels to identify key potential support and resistance zones, based on recent price trends.
July 11, 2026 a 05:08 am
Currencies