May 03, 2026 a 02:03 pm
CTRA: Trend and Support & Resistance Analysis - Coterra Energy Inc.
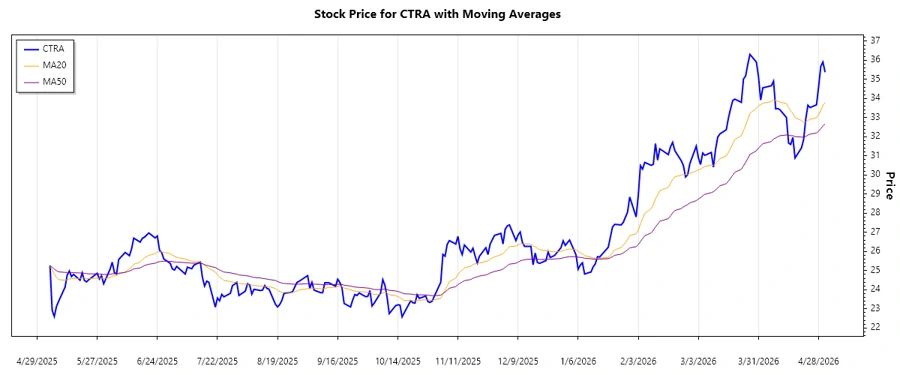
Coterra Energy Inc. has shown significant price movements in recent months. Analyzing the closing prices, we've seen a transition from a marked uptrend beginning in early 2026 to a possible stabilization. The company's extensive presence in major oil and gas sectors in the US supports its growth potential, but volatility in energy prices may impact its stock performance.
Trend Analysis
| Date | Closing Price | Trend |
|---|---|---|
| 2026-05-01 | 35.38 | ▲ |
| 2026-04-30 | 35.91 | ▲ |
| 2026-04-29 | 35.68 | ▲ |
| 2026-04-28 | 34.63 | ▲ |
| 2026-04-27 | 33.67 | ▲ |
| 2026-04-24 | 33.53 | ▲ |
| 2026-04-23 | 33.65 | ▲ |
When analyzing the exponential moving averages, EMA20 is above EMA50, indicating a continued upward trend. This reflects strong investor interest and potential for further gains.
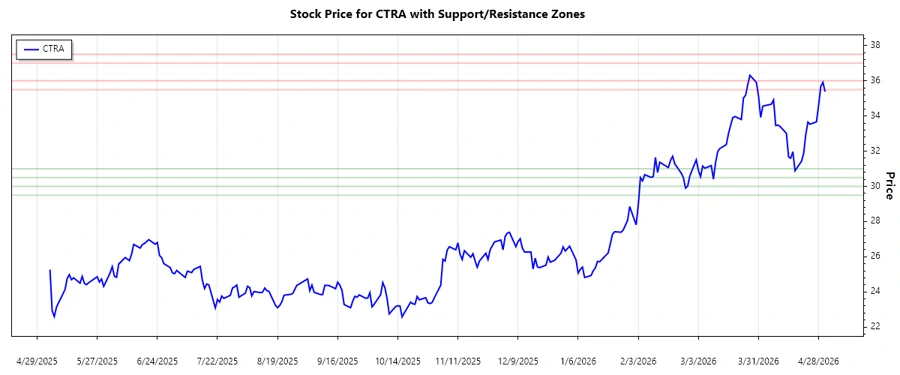
Support- and Resistance
| Zone | From | To |
|---|---|---|
| Support 1 | 30.50 | 31.00 |
| Support 2 | 29.50 | 30.00 |
| Resistance 1 | 35.50 | 36.00 |
| Resistance 2 | 37.00 | 37.50 |
The current price is moving towards the resistance zone of 35.50 to 36.00, indicating potential selling pressure if these levels are reached.
Conclusion
Coterra Energy's stock has recently demonstrated a robust upward trend, significantly driven by its strategic positioning in key energy markets. However, the proximity to resistance levels could introduce volatility. Investors should monitor price action around 35.50 to 36.00 for signs of resistance. The company's potential to continue its upward trajectory is promising, but fluctuations in the energy sector remain a risk factor. Overall, continued positive momentum could provide attractive opportunities, but caution is advised as the stock approaches key resistance levels.
This structured and mobile-friendly report provides an analysis of the Coterra Energy Inc. stock, incorporating key trend indicators and potential support and resistance zones, along with concise interpretations.
Smart Data Insight
Master the Perfect Entry & Exit for this Stock
Don't leave your profits to chance. Historically, this stock follows specific seasonal patterns that institutional traders use to maximize returns.
- ✅ Identify the "Golden Buying Window"
- ✅ Avoid high-risk correction cycles
- ✅ Backtested data from the last 20+ years