April 14, 2026 a 04:44 pm
CTRA: Fibonacci Analysis - Coterra Energy Inc.
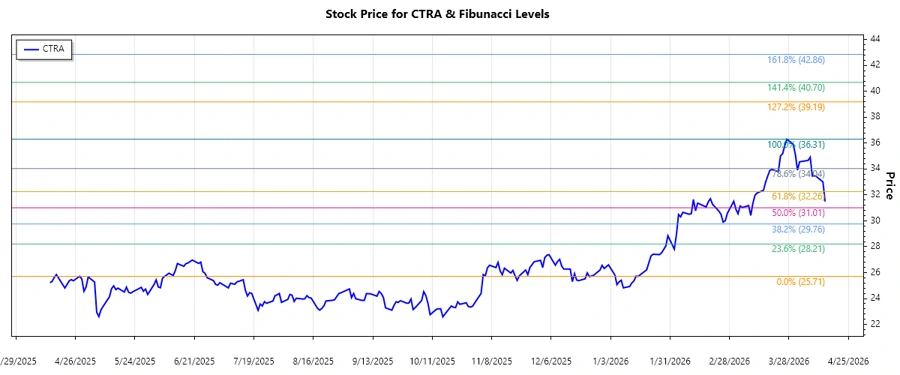
The Coterra Energy Inc. (CTRA) has shown a significant upward trend over the past few months. This independent oil and gas company, with its strong presence in the Marcellus Shale and Permian Basin, has capitalized on rising energy prices. With its diverse portfolio and strategic operations, investors have witnessed a robust performance, making it an attractive option. The recent uptrend in stock price is evidence of market confidence in the company's operational success and future prospects.
Fibonacci Analysis
| Detail | Data |
|---|---|
| Trend Start Date | 2026-01-16 |
| Trend End Date | 2026-04-14 |
| High Point (Price/Date) | $36.31 on 2026-03-27 |
| Low Point (Price/Date) | $25.71 on 2026-01-16 |
| Fibonacci Levels |
|
| Current Position | Price is at $31.495, within the 0.382 retracement level |
| Technical Interpretation | The 0.382 level acts as a potential support zone, indicating a possible continuation of the bullish trend. |
Conclusion
Coterra Energy Inc. continues to show promise, bolstered by stable operations in key resource-rich regions such as the Marcellus and Permian Basins. The recent Fibonacci levels suggest that there may be strong support, with potential upward momentum if energy market conditions remain favorable. However, external factors such as regulatory changes in the energy sector and global oil prices could present risks. Analysts should remain vigilant about fluctuations in these variables as they may impact the long-term sustainability of the upward trend. Overall, the stock's positive technical indicators, combined with a strong operational background, make it a viable investment consideration for those seeking exposure to the energy sector.