February 22, 2026 a 12:46 pm


CTRA: Dividend Analysis - Coterra Energy Inc.
Coterra Energy Inc. stands as a noteworthy contender within the energy sector, bolstered by its robust market capitalization of over $23 billion. The company boasts a commendable dividend yield of 3.4%, paired with a stable history of 36 years of payments, albeit with a recent interruption. Its commitment to rewarding shareholders, as evidenced by an EPS payout ratio of 39%, positions it as a company on the cusp of maintaining steady income distributions.
📊 Overview
Coterra Energy Inc. exemplifies a blend of strategic growth and shareholder value, situated in the energy sector. With a commendable dividend yield of 3.41% and a current dividend per share of $0.84, it reflects financial stability over decades.
| Metric | Value |
|---|---|
| Sector | Energy |
| Dividend yield | 3.41% |
| Current dividend per share | 0.84 USD |
| Dividend history | 36 years |
| Last cut or suspension | 2024 |
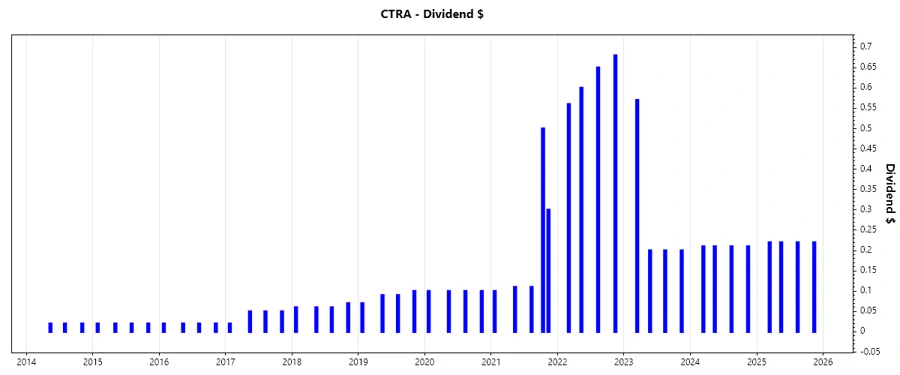
📈 Dividend History
The dividend history of Coterra Energy Inc. illustrates a long-standing tradition of shareholder returns, crucial for investors prioritizing passive income streams. An illustrious history of incremental payouts, notwithstanding the recent suspension, underscores tactical fiscal management.
| Year | Dividend Per Share (USD) |
|---|---|
| 2025 | 0.88 |
| 2024 | 0.84 |
| 2023 | 1.17 |
| 2022 | 2.49 |
| 2021 | 1.12 |
📈 Dividend Growth
The assessment of dividend growth underscores long-term viability, crucial for investors aiming for capital appreciation alongside income. An analysis reveals a long-term growth trajectory despite short-term reductions in dividend thinking.
| Time | Growth |
|---|---|
| 3 years | -0.29% |
| 5 years | 0.17% |
The average dividend growth is 0.17% over 5 years. This shows moderate but steady dividend growth.
🗣️ Payout Ratio
The payout ratio offers insights into a company’s fiscal health and its ability to sustain dividend payments. With an EPS payout ratio of 39.05% and a free cash flow payout at 44.29%, Coterra exhibits a balanced approach towards its obligations and growth opportunities.
| Key figure | Ratio |
|---|---|
| EPS-based | 39.05% |
| Free cash flow-based | 44.29% |
The low payout ratios suggest that Coterra has substantial leeway to maintain, or potentially increase, its dividend payments.
📊 Cashflow & Capital Efficiency
Understanding cashflow dynamics is paramount for a dividend analysis. Cashflow efficiency underpins dividend sustainability. The financial data indicates robust capital allocation and strategic cash deployment in the last fiscal year.
| Year | 2024 | 2023 | 2022 |
|---|---|---|---|
| Free Cash Flow Yield | 5.40% | 8.08% | 19.15% |
| Earnings Yield | 5.91% | 8.42% | 20.78% |
| CAPEX to Operating Cash Flow | 63.36% | 57.38% | 31.34% |
| Stock-based Compensation to Revenue | 0.62% | 1.00% | 0.77% |
| Free Cash Flow / Operating Cash Flow Ratio | 36.63% | 42.62% | 68.66% |
Such figures indicate a proficient management of cash flows and capital, ensuring long-term sustainability and continous shareholder benefits.
📊 Balance Sheet & Leverage Analysis
The balance sheet health is critical in assessing a firm's leverage and risk profile. Coterra's financial ratios reveal prudent use of debt and strong liquidity, contributing to strategic financial management.
| Year | 2024 | 2023 | 2022 |
|---|---|---|---|
| Debt-to-Equity | 28.97% | 19.37% | 20.53% |
| Debt-to-Assets | 17.58% | 12.37% | 12.90% |
| Debt-to-Capital | 22.47% | 16.23% | 17.03% |
| Net Debt to EBITDA | 0.91 | 0.41 | 0.28 |
| Current Ratio | 1.02 | 1.21 | 1.85 |
| Quick Ratio | 2.88 | 1.18 | 1.80 |
| Financial Leverage | 1.64 | 1.57 | 1.59 |
The company manages its leverage cautiously, maintaining an optimal debt level to ensure stability and growth flexibility.
📊 Fundamental Strength & Profitability
Coterra Energy Inc.'s fundamental metrics signify solid operational efficiency and profitability, vital for long-term investor confidence and portfolio growth.
| Year | 2024 | 2023 | 2022 |
|---|---|---|---|
| Return on Equity | 8.54% | 12.46% | 32.11% |
| Return on Assets | 5.18% | 7.96% | 20.17% |
| Net Margin | 20.53% | 28.59% | 42.73% |
| EBIT Margin | 26.57% | 38.72% | 55.07% |
| EBITDA Margin | 60.35% | 67.59% | 72.25% |
| Gross Margin | 30.96% | 38.76% | 63.79% |
| Research & Development to Revenue | 0.00% | 0.00% | 0.00% |
Consistent profitability margins demonstrate strong operational skills, ensuring long-term profitability and growth.
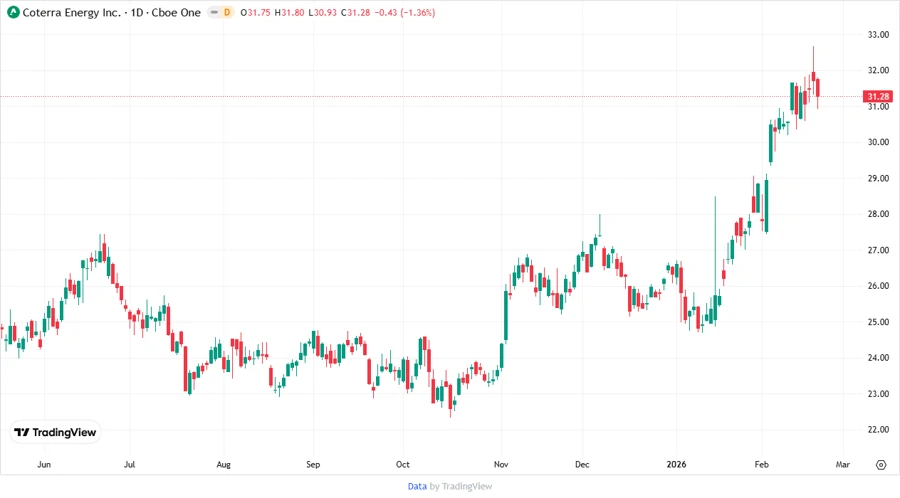
📈 Price Development
🗣️ Dividend Scoring System
| Criteria | Score | Score Bar |
|---|---|---|
| Dividend yield | 3 | |
| Dividend Stability | 3 | |
| Dividend growth | 2 | |
| Payout ratio | 4 | |
| Financial stability | 4 | |
| Dividend continuity | 3 | |
| Cashflow Coverage | 4 | |
| Balance Sheet Quality | 4 |
Overall Score: 27 out of 40
🏁 Rating
Based on a comprehensive evaluation, Coterra Energy Inc. maintains a moderate dividend offering with potential growth, albeit with some volatility. Its strong emphasis on capital efficiency and financial stability suggests a promising outlook for dividend continuance. Investors valuing a balanced approach between yield and growth might find Coterra a prudent addition to their portfolio.