June 18, 2025 a 11:31 am


CTRA: Dividend Analysis - Coterra Energy Inc.
Coterra Energy Inc. shows a promising dividend profile with a respectable dividend yield of 3.48%, backed by 36 years of continuous dividend history. Despite a recent decrease in short-term dividend growth, the long-term metrics provide a sense of stability for investors seeking reliable income. With strong balance sheet indicators and prudent payout ratios, the company positions itself as a sturdy option amidst market fluctuations.
📊 Overview
Coterra Energy Inc. operates within the Energy sector, offering a current dividend yield of 3.48% with a per-share dividend of $0.84. The company holds a remarkable record of sustaining dividends for 36 years, with no recent cuts or suspensions. This stability is noteworthy for long-term dividend investors. Below is a summarized overview:
| Sector | Dividend Yield | Current Dividend Per Share (USD) | Dividend History | Last Cut or Suspension |
|---|---|---|---|---|
| Energy | 3.48% | 0.84 | 36 years | None |
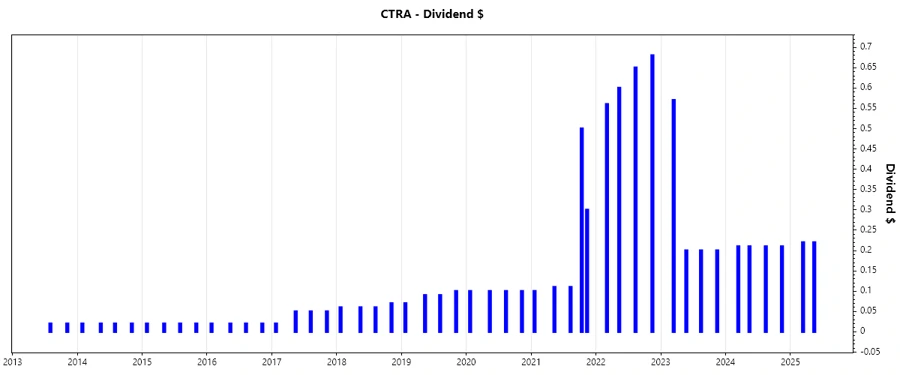
📉 Dividend History
The historical dividend payments of Coterra highlight a commitment to returning value to shareholders despite fluctuating market conditions. This historical perspective is essential as it not only proves sustainability but also provides insights into the company’s adaptability to economic challenges.
| Year | Dividend Per Share (USD) |
|---|---|
| 2025 | 0.44 |
| 2024 | 0.84 |
| 2023 | 1.17 |
| 2022 | 2.49 |
| 2021 | 1.12 |
📈 Dividend Growth
The dividend growth analysis reveals a minimal decrease over 3 years of -0.09% and a moderate increase over five years of 19.14%. This indicates a commitment to augmenting shareholder returns despite occasional setbacks. While recent figures dip slightly, the long-term outlook remains promising and warrants investor confidence in potential future increases.
| Time | Growth |
|---|---|
| 3 years | -0.09% |
| 5 years | 19.14% |
The average dividend growth is 19.14% over 5 years. This shows moderate but steady dividend growth.
🗣️ Payout Ratio
Payout ratios provide insights into the company's ability to maintain or grow its dividend payments. With an EPS-based payout ratio of 49.56% and a Free Cash Flow-based ratio of 50.98%, Coterra Energy effectively balances rewarding shareholders with reinvesting for growth, indicating a healthy payout policy that can sustain through varied economic cycles.
| Key figure | Ratio |
|---|---|
| EPS-based | 49.56% |
| Free cash flow-based | 50.98% |
These payout ratios illustrate a balanced approach, ensuring dividends remain sustainable without compromising financial flexibility.
💰 Cashflow & Capital Efficiency
Cash flow dynamics are crucial to evaluating dividend sustainability. With a Free Cash Flow Yield of 6.19% and a CAPEX to Operating Cash Flow ratio of 59.10%, the company demonstrates efficient capital allocation. The Stock-based Compensation to Revenue ratio of 1.29% shows restraint, ensuring more profits are distributed to essential needs and shareholder returns.
| Year | 2023 | 2024 |
|---|---|---|
| Free Cash Flow Yield | 8.08% | 5.40% |
| Earnings Yield | 8.42% | 5.92% |
| CAPEX to Operating Cash Flow | 57.38% | 63.36% |
| Stock-based Compensation to Revenue | 1.04% | 1.12% |
| Free Cash Flow / Operating Cash Flow Ratio | 42.62% | 36.64% |
The data reflects stable cash flow management, supporting ongoing dividend distributions while retaining enough for growth investments.
📊 Balance Sheet & Leverage Analysis
Analyzing leverage provides insights into financial stability. Debt-to-Equity and Debt-to-Assets ratios indicate Coterra's conservative approach to debt, crucial for long-term dividend sustainability. The Current and Quick ratios show ample liquidity, essential for operation continuity, irrespective of market conditions.
| Year | 2023 | 2024 |
|---|---|---|
| Debt-to-Equity | 19.36% | 28.97% |
| Debt-to-Assets | 12.37% | 17.58% |
| Debt-to-Capital | 16.22% | 22.47% |
| Net Debt to EBITDA | 40.86% | 53.52% |
| Current Ratio | 1.21 | 2.92 |
| Quick Ratio | 1.18 | 2.88 |
| Financial Leverage | 1.56 | 1.65 |
The firm’s conservative leverage and robust liquidity position it well for future financial obligations, securing its dividend policy against potential economic stresses.
📊 Fundamental Strength & Profitability
Fundamental and profitability metrics are key indicators of a company's operational health, crucial for sustaining dividend payments. Coterra's Return on Equity and wide profit margins showcase its ability to generate returns that can bolster continued dividend payments.
| Year | 2023 | 2024 |
|---|---|---|
| Return on Equity | 12.45% | 8.54% |
| Return on Assets | 7.96% | 5.18% |
| Net Margin | 28.59% | 20.54% |
| EBIT Margin | 39.04% | 26.58% |
| EBITDA Margin | 67.59% | 60.39% |
| Gross Margin | 44.09% | 36.55% |
| Research & Development to Revenue | 0% | 0% |
The company's strong profitability metrics underline an economically sound infrastructure that supports resilient dividend delivery, reflecting its operational prowess.
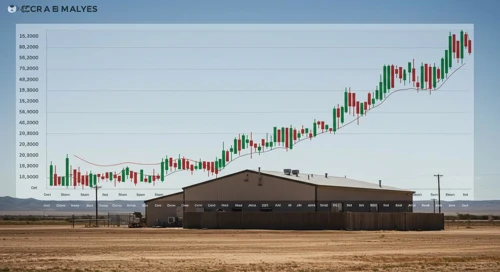
📈 Price Development
🎯 Dividend Scoring System
Below is an evaluation of key dividend criteria rated on a 1 to 5 points scale, resulting in an overall score which reflects Coterra Energy's dividend profile robustly.
| Criterion | Score | Rating |
|---|---|---|
| Dividend yield | 4 | |
| Dividend Stability | 5 | |
| Dividend growth | 3 | |
| Payout ratio | 4 | |
| Financial stability | 4 | |
| Dividend continuity | 5 | |
| Cashflow Coverage | 4 | |
| Balance Sheet Quality | 4 |
Overall Score: 33/40
✅ Rating
In conclusion, Coterra Energy Inc. presents as a commendable stock for dividend-focused portfolios with a remarkable dividend history, solid payout ratios, and impressive financial metrics. The company balances shareholder returns with growth investments aptly, suggesting a sustainable future for dividends. Investors seeking reliability with moderate growth potential will find Coterra Energy a strategic addition to their portfolios.
Smart Data Insight
Master the Perfect Entry & Exit for this Stock
Don't leave your profits to chance. Historically, this stock follows specific seasonal patterns that institutional traders use to maximize returns.
- ✅ Identify the "Golden Buying Window"
- ✅ Avoid high-risk correction cycles
- ✅ Backtested data from the last 20+ years