May 23, 2026 a 09:03 am

CTAS: Trend and Support & Resistance Analysis - Cintas Corporation
Cintas Corporation, with its varied business services, including uniform rentals and safety services, demonstrates resilience in a competitive market. The company's robust distribution network and established market presence have strengthened its growth potential. Recent stock data suggests a technical positioning that might attract both momentum traders and long-term investors.
Trend Analysis
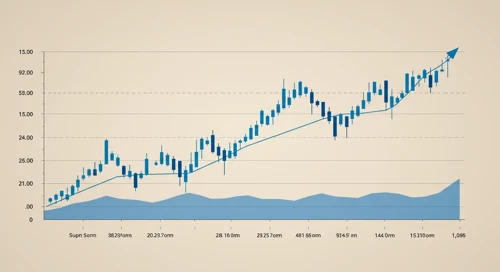
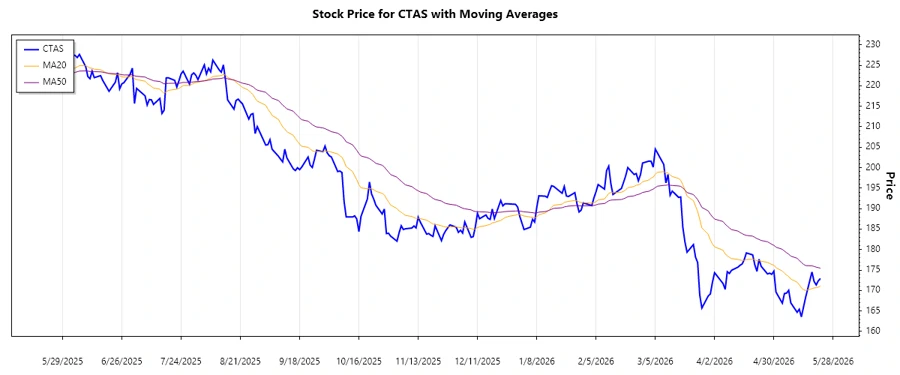
Analyzing the historical data for Cintas Corporation (CTAS), the current trend over recent months shows signs of volatility, with significant fluctuations in stock price. Calculations based on recent closing prices indicate:
| Date | Closing Price | Trend |
|---|---|---|
| 2026-05-22 | $172.93 | ▼ |
| 2026-05-21 | $172.36 | ▼ |
| 2026-05-20 | $171.36 | ▼ |
| 2026-05-19 | $172.20 | ▲ |
| 2026-05-18 | $174.51 | ▲ |
| 2026-05-15 | $168.31 | ▼ |
| 2026-05-14 | $165.95 | ▼ |
The short to mid-term EMAs indicate a prevailing bearish trend as EMA20 < EMA50, suggesting a downward momentum for this period. The responsive stock chart below provides visual insight into this trend:
Support and Resistance
Based on technical analysis, key support and resistance levels for Cintas Corporation are established, providing insight into potential price reversal areas:
| Zone Type | From | To |
|---|---|---|
| Support | $163.00 | $167.00 |
| Support | $171.50 | $172.00 |
| Resistance | $175.50 | $178.00 |
| Resistance | $182.00 | $185.00 |
The current stock price is hovering within the second support zone, suggesting potential stability or a forthcoming upward correction. The strategic visual representation below enhances the understanding:
Conclusion
The Cintas Corporation's stock exhibits a bearish tendency in the short to mid-term, marked by a slight decline in price. With its position in a support zone, there is room for a potential recovery, especially given the corporation's solid market fundamentals. Analysts should watch for a breakout above resistance levels to confirm any reversal. Alternatively, a fall below the support zones might imply continued bearishness. Investment decisions should weigh both technical insights and the company's fundamental strengths.
Smart Data Insight
Master the Perfect Entry & Exit for this Stock
Don't leave your profits to chance. Historically, this stock follows specific seasonal patterns that institutional traders use to maximize returns.
- ✅ Identify the "Golden Buying Window"
- ✅ Avoid high-risk correction cycles
- ✅ Backtested data from the last 20+ years