
July 04, 2026 a 03:30 pm


CTAS: Dividend Analysis - Cintas Corporation
Cintas Corporation is a stalwart in the service sector with an impressive 42 years of continuous dividend history. Despite a relatively modest dividend yield of 1.07%, the company's commitment to dividend payouts is evident through a stable and growing dividend track record. With no history of dividend cuts or suspensions, investors can look forward to steady income.
📊 Overview
Cintas Corporation, recognized for its service industry excellence, maintains robust financial health with a market capitalization of over $72 billion. The dividend yield stands at a conservative 1.07%, indicating a focus on sustainable growth rather than aggressive payouts. A dividend history spanning 42 years without cuts underscores their stability and reliability in rewarding shareholders. Maintaining dividends without suspensions highlights their consistent operational strength and cash flow generation.
| Aspect | Detail |
|---|---|
| Sector | Service |
| Dividend yield | 1.07% |
| Current dividend per share | $1.52 |
| Dividend history | 42 years |
| Last cut or suspension | None |
🗣️ Dividend History
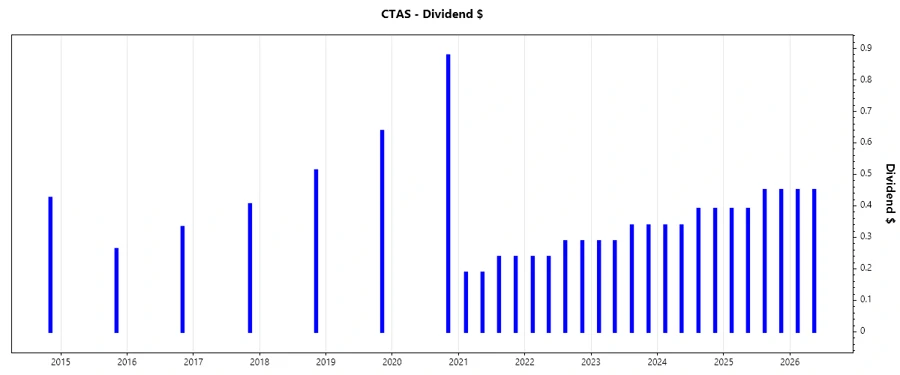
In its relentless pursuit of delivering value to shareholders, Cintas has showcased remarkable consistency in its dividend payments. This history indicates a firm foundation and strategic foresight, crucial for long-term investors focusing on dividend income.
| Year | Dividend per Share (USD) |
|---|---|
| 2026 | $0.90 |
| 2025 | $1.68 |
| 2024 | $1.455 |
| 2023 | $1.25 |
| 2022 | $1.05 |
📈 Dividend Growth
Cintas has demonstrated a robust dividend growth trend over recent years, reflecting its commitment to increasing shareholder value. This growth is indicative of the company's sound financial health and proactive management approach, essential for maintaining competitive edge and investor trust over time.
| Time | Growth |
|---|---|
| 3 years | 16.96% |
| 5 years | 13.87% |
The average dividend growth is 13.87% over 5 years. This shows moderate but steady dividend growth.
⚠️ Payout Ratio
The payout ratio assesses the safety of dividend payments, with lower figures generally indicating more room for future growth. Here, Cintas's payout ratios suggest a prudent and well-managed dividend policy, aligning with sustainable financial practices.
| Key figure | Ratio |
|---|---|
| EPS-based | 31.42% |
| Free cash flow-based | 33.90% |
Both EPS-based and FCF-based payout ratios are comfortably low, indicating that Cintas is not over-leveraged with its dividend commitments. This provides cushion for future dividend increases even during challenging economic conditions.
✅ Cashflow & Capital Efficiency
Robust cash flow is critical for sustaining operations and financing dividends without reliance on debt. Cintas demonstrates efficient capital usage, ensuring sustainable cash production relative to its obligations. This promises stability and continuity in shareholder returns.
| Metric | 2025 | 2024 | 2023 |
|---|---|---|---|
| Free Cash Flow Yield | 1.92% | 2.42% | 2.63% |
| Earnings Yield | 1.98% | 2.28% | 2.81% |
| CAPEX to Operating Cash Flow | 18.78% | 19.69% | 20.72% |
| Stock-based Compensation to Revenue | 1.24% | 1.22% | 1.18% |
| Free Cash Flow / Operating Cash Flow Ratio | 81.12% | 80.31% | 79.28% |
The cash flow metrics indicate solid cash generation and management efficiency, reinforcing Cintas's ability to fund dividends sustainably and pursue growth opportunities without compromising financial health.
Balance Sheet & Leverage Analysis
A strong balance sheet coupled with smart leverage management ensures long-term viability and operational flexibility. Cintas's debt metrics reflect a balanced approach to capital structure, supporting steady cash flow while minimizing financial risk.
| Metric | 2025 | 2024 | 2023 |
|---|---|---|---|
| Debt-to-Equity | 0.57 | 0.62 | 0.69 |
| Debt-to-Assets | 0.27 | 0.28 | 0.30 |
| Debt-to-Capital | 0.36 | 0.38 | 0.41 |
| Net Debt to EBITDA | 0.90 | 0.92 | 1.15 |
| Current Ratio | - | - | - |
| Quick Ratio | 1.82 | 0.90 | 1.08 |
| Financial Leverage | 2.09 | 2.20 | 2.28 |
These ratios indicate prudent financial management, with manageable leverage levels providing security and flexibility. The company's approach mitigates risk while facilitating strategic growth.
Fundamental Strength & Profitability
High profitability and robust fundamental strength are the hallmarks of a well-performing enterprise. Cintas showcases superior margins and healthy returns, reflecting effective cost controls and competitive positioning.
| Metric | 2025 | 2024 | 2023 |
|---|---|---|---|
| Return on Equity | 38.69% | 36.41% | 34.89% |
| Return on Assets | 18.45% | 16.58% | 15.27% |
| Net Margin | 17.53% | 16.38% | 15.29% |
| EBIT Margin | 22.87% | 21.69% | 20.47% |
| EBITDA Margin | 27.65% | 26.30% | 25.20% |
| Gross Margin | 50.04% | 48.83% | 47.34% |
| R&D to Revenue | 0.28% | 0.28% | 0.28% |
Cintas demonstrates exceptional profitability figures and efficient use of resources, emphasizing its capacity to maximize shareholder value through strategic execution and innovation.
📉 Price Development
✅ Dividend Scoring System
| Criteria | Score | |
|---|---|---|
| Dividend yield | 3 | |
| Dividend Stability | 5 | |
| Dividend growth | 4 | |
| Payout ratio | 4 | |
| Financial stability | 5 | |
| Dividend continuity | 5 | |
| Cashflow Coverage | 4 | |
| Balance Sheet Quality | 5 |
Total Score: 35/40
🏁 Rating
Cintas Corporation presents a compelling case for dividend investors who value stability and growth. With consistent dividend history and solid financials, Cintas proves to be a reliable choice. Its well-structured payout policy and robust capital management enhance its position as a strong contender for long-term portfolios.
Smart Data Insight
Master the Perfect Entry & Exit for this Stock
Don't leave your profits to chance. Historically, this stock follows specific seasonal patterns that institutional traders use to maximize returns.
- ✅ Identify the "Golden Buying Window"
- ✅ Avoid high-risk correction cycles
- ✅ Backtested data from the last 20+ years