November 06, 2025 a 03:32 pm


CTAS: Dividend Analysis - Cintas Corporation
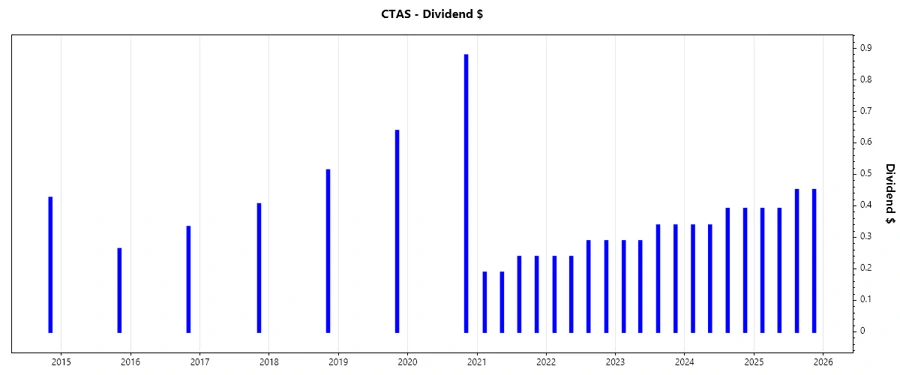
Cintas Corporation has demonstrated robust dividend performance over the years, sustaining an impressive track record of 41 years of dividend history. The company's ability to maintain dividend payouts despite a recent cut in 2021 highlights its resilience, making it an enticing option for investors seeking steady income streams.
📊 Overview
Cintas Corporation operates primarily in the Business Services sector. With a modest dividend yield of 0.90%, Cintas provides a current dividend per share of $1.52 and boasts an impressive dividend history spanning 41 years. The last recorded cut or suspension was in 2021, indicating the company's commitment to sustaining dividend payouts.
| Metric | Value |
|---|---|
| Sector | Business Services |
| Dividend Yield | 0.90% |
| Current Dividend per Share | 1.52 USD |
| Dividend History | 41 years |
| Last Cut or Suspension | 2021 |
📈 Dividend History
Cintas Corporation has a long-standing history of dividend payments, reflecting its financial strength and commitment to shareholder returns. This historical track is crucial for assessing the reliability of future dividends, providing assurance against potential financial turbulence.
| Year | Dividend per Share (USD) |
|---|---|
| 2025 | 1.68 |
| 2024 | 1.455 |
| 2023 | 1.25 |
| 2022 | 1.05 |
| 2021 | 0.85 |
📊 Dividend Growth
Dividend growth is a critical metric indicating a company's potential for increasing future payouts. Cintas has demonstrated consistent growth over the past few years, showcasing its capacity for financial performance improvement and shareholder value enhancement.
| Time | Growth |
|---|---|
| 3 years | 0.20% |
| 5 years | 0.18% |
The average dividend growth is 0.18% over 5 years. This shows moderate but steady dividend growth.
📉 Payout Ratio
The payout ratio provides insights into how sustainable a company's dividend payments are relative to its earnings. A low ratio might suggest room for growth or reinvestment, whereas a high ratio could indicate potential payout cuts.
| Key Figure | Ratio |
|---|---|
| EPS-based | 33.02% |
| Free Cash Flow-based | 36.07% |
The EPS-based payout ratio of 33.02% and FCF-based payout ratio of 36.07% reflect a well-managed distribution policy, indicating a prudent balance between rewarding shareholders and sustaining investment for growth.
📈 Cashflow & Capital Efficiency
Analyzing cashflow and capital efficiency is essential for evaluating the company's operational performance and its ability to generate sufficient cash to support dividend outflows.
| Year | 2023 | 2024 | 2025 |
|---|---|---|---|
| Free Cash Flow Yield | 2.64% | 2.42% | 1.92% |
| Earnings Yield | 2.81% | 2.28% | 1.98% |
| CAPEX to Operating Cash Flow | 20.72% | 19.69% | 18.88% |
| Stock-based Compensation to Revenue | 1.18% | 1.22% | 1.24% |
| Free Cash Flow / Operating Cash Flow Ratio | 79.28% | 80.31% | 81.12% |
With strong cash flow yield and efficient capital utilization, Cintas demonstrates a solid foundation to support continuous capital investment and maintain dividend stability.
🗣️ Balance Sheet & Leverage Analysis
The analysis of balance sheet metrics helps in understanding the company's financial stability and ability to meet its long-term obligations, which is crucial for sustaining dividend payments.
| Year | 2023 | 2024 | 2025 |
|---|---|---|---|
| Debt-to-Equity | 0.69 | 0.62 | 0.57 |
| Debt-to-Assets | 0.30 | 0.28 | 0.27 |
| Debt-to-Capital | 0.41 | 0.38 | 0.36 |
| Net Debt to EBITDA | 1.15 | 0.92 | 0.86 |
| Current Ratio | 1.49 | 1.12 | 2.24 |
| Quick Ratio | 1.08 | 0.90 | 1.82 |
| Financial Leverage | 2.28 | 2.20 | 2.10 |
The steady improvement in leverage ratios and robust liquidity indicators underscore Cintas' financial resilience and flexibility in capital management.
✅ Fundamental Strength & Profitability
Evaluating profitability metrics is crucial as they indicate the company's ability to generate earnings relative to its assets, equity, and invested capital, which supports dividend sustainability.
| Year | 2023 | 2024 | 2025 |
|---|---|---|---|
| Return on Equity | 34.89% | 36.41% | 38.69% |
| Return on Assets | 15.27% | 16.58% | 18.45% |
| Margins: Net | 15.29% | 16.38% | 17.53% |
| Margins: EBIT | 20.47% | 21.69% | 22.87% |
| Margins: EBITDA | 25.20% | 26.30% | 27.65% |
| Margins: Gross | 47.34% | 48.83% | 50.04% |
| Research & Development to Revenue | 0.00% | 0.30% | 0.29% |
Strong profitability and margin figures affirm Cintas' competence in generating substantial returns, facilitating sustainable dividend growth.
Price Development
📊 Dividend Scoring System
| Criteria | Score | Score Bar |
|---|---|---|
| Dividend Yield | 3 | |
| Dividend Stability | 5 | |
| Dividend Growth | 4 | |
| Payout Ratio | 4 | |
| Financial Stability | 5 | |
| Dividend Continuity | 4 | |
| Cashflow Coverage | 4 | |
| Balance Sheet Quality | 4 |
Overall Score: 33/40
🗣️ Rating
Cintas Corporation exhibits a robust dividend profile supported by solid financial metrics and consistent growth. Despite a lower yield, its stability and growth potential make it a prudent choice for conservative investors. The long dividend history and strong financials warrant a recommendation as a strong dividend investment.
Smart Data Insight
Master the Perfect Entry & Exit for this Stock
Don't leave your profits to chance. Historically, this stock follows specific seasonal patterns that institutional traders use to maximize returns.
- ✅ Identify the "Golden Buying Window"
- ✅ Avoid high-risk correction cycles
- ✅ Backtested data from the last 20+ years