
July 24, 2026 a 08:15 am
CSX: Trend and Support & Resistance Analysis - CSX Corporation
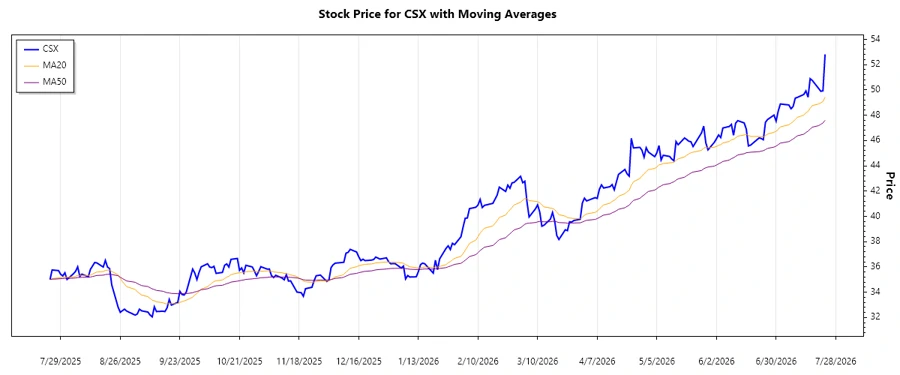
CSX Corporation's recent stock activity has demonstrated substantial momentum. After experiencing a period of consolidation, the stock price has begun showing signs of consistent upward movement. The technical indicators, particularly the EMA trends, are currently pointing towards a potential sustained uptrend, which could attract more investors in the near future. However, it remains imperative to monitor critical support and resistance zones that could influence short- to medium-term price dynamics.
Trend Analysis
The following table summarizes the latest trend data for the CSX stock, including the calculated EMA20 and EMA50. Based on the comparison, the stock is currently in an ▲ uptrend:
| Date | Close Price | Trend |
|---|---|---|
| 2026-07-23 | 52.81 | ▲ Up |
| 2026-07-22 | 49.93 | ▲ Up |
| 2026-07-21 | 49.89 | ▲ Up |
| 2026-07-20 | 50.11 | ▲ Up |
| 2026-07-17 | 50.75 | ▲ Up |
| 2026-07-16 | 50.89 | ▲ Up |
| 2026-07-15 | 49.43 | ▲ Up |
The recent trend suggests a positive momentum in upward price movement, supported by the EMA crossovers. This is indicative of potential further growth, inviting for bullish interest.
Support and Resistance
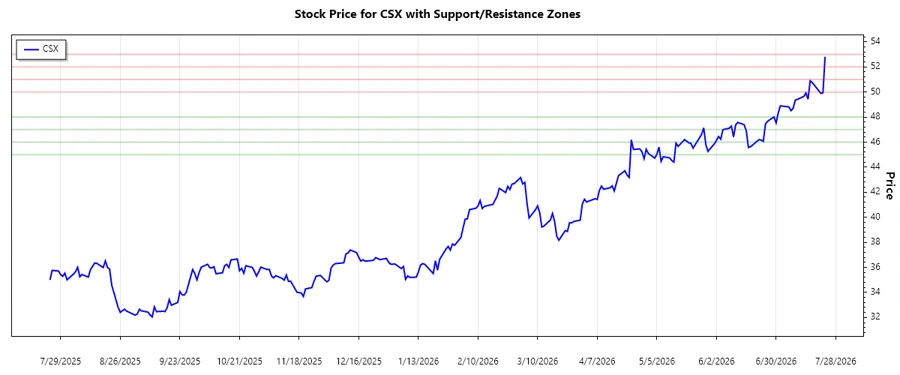
Below are the identified key support and resistance zones. These levels are critical in assessing potential price movements:
| Zone Type | Level From | Level To |
|---|---|---|
| Support | 47.00 | 48.00 |
| Support | 45.00 | 46.00 |
| Resistance | 50.00 | 51.00 |
| Resistance | 52.00 | 53.00 |
The stock is currently navigating within a resistance zone, suggesting caution for potential price rejection at these levels.
Conclusion
Overall, CSX Corporation's stock currently exhibits a promising upward trend, driven by favorable EMA indicators. The tested resistance zones add a layer of uncertainty as to whether the stock can conserve its present momentum without correction. Investors are advised to monitor these pressure points, as they could influence strategic entry or exit decisions. While the bullish prospects are evident, they are counterbalanced by the risks of encountering strong resistance levels in the immediate trading range.
json In this technical analysis, the CSX stock demonstrates an upward trend bolstered by both EMA and market momentum. Current resistance zones provide cautionary checkpoints for investors deliberating strategic movements within the market.
Smart Data Insight
Master the Perfect Entry & Exit for this Stock
Don't leave your profits to chance. Historically, this stock follows specific seasonal patterns that institutional traders use to maximize returns.
- ✅ Identify the "Golden Buying Window"
- ✅ Avoid high-risk correction cycles
- ✅ Backtested data from the last 20+ years