March 23, 2026 a 11:44 am
CSX: Fibonacci Analysis - CSX Corporation
CSX Corporation's stock has shown significant movement in recent months, reflecting both the company's strong position in the rail transportation industry and broader market dynamics. With a vast network and a comprehensive service portfolio, CSX remains a key player in transporting essential goods across North America. The recent data suggests a dominant uptrend, providing an opportunity for investors to capitalize on potential price movements. This analysis focuses on Fibonacci retracement levels, a key tool for identifying potential support and resistance areas.
Fibonacci Analysis
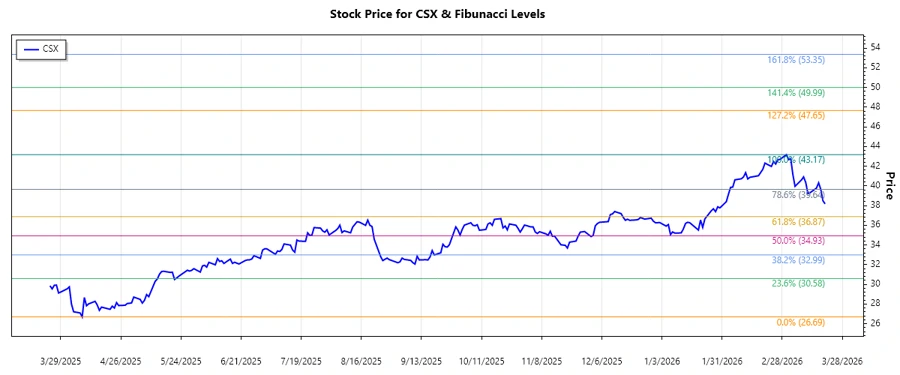
This analysis covers an upward trend observed in the CSX stock price, identifying key Fibonacci retracement levels to assess potential support and resistance points.
| Analysis | Details |
|---|---|
| Trend Start Date | 2025-04-09 |
| Trend End Date | 2026-03-05 |
| High Price | $43.17 (2026-03-02) |
| Low Price | $26.69 (2025-04-08) |
| Fibonacci Level | Price Level |
|---|---|
| 0.236 | $35.85 |
| 0.382 | $38.20 |
| 0.5 | $39.93 |
| 0.618 | $41.66 |
| 0.786 | $43.54 |
Currently, the CSX stock price is within the 0.236 retracement zone, indicating a level where some reversal could be expected. Technical analysis suggests this level could serve as support during the uptrend.
Conclusion
CSX Corporation has demonstrated resilience with a notable upward trend, bolstered by its strategic initiatives and essential role in freight transportation. The Fibonacci retracement analysis highlights critical levels where price adjustments may occur, providing traders insights into potential buy or sell decisions. Despite a robust outlook, market volatility and changes in macroeconomic conditions present inherent risks. However, CSX's extensive network and market position continue to offer competitive advantages in sustaining growth and profitability.