
October 16, 2025 a 10:15 am

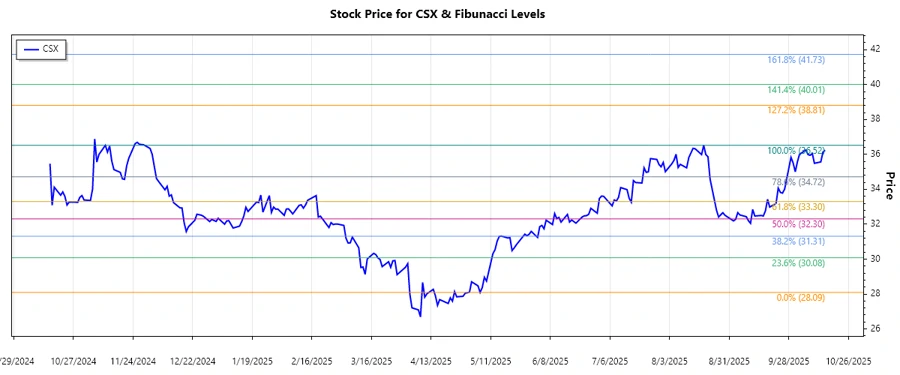
CSX: Fibonacci Analysis - CSX Corporation
CSX Corporation, a prominent player in North America's rail transportation sector, has exhibited significant price movements, reflecting underlying economic trends and sectoral shifts in demand. Recently, the stock has shown notable trends influenced by broader market conditions and company-specific developments.
Fibonacci Analysis
| Attribute | Details |
|---|---|
| Trend Start Date | 2025-05-09 |
| Trend End Date | 2025-10-15 |
| High Point | $36.52 on 2025-08-19 |
| Low Point | $28.09 on 2025-05-06 |
Fibonacci Levels:
| Level | Price |
|---|---|
| 0.236 | $30.36 |
| 0.382 | $31.46 |
| 0.5 | $32.31 |
| 0.618 | $33.17 |
| 0.786 | $34.35 |
The current price of $36.24 resides outside the Fibonacci retracement levels, indicating potential market strength and possibly reaching new highs. This positions the technical outlook towards continued momentum with $36.52 as potential resistance, while $34.35 as immediate support.
Conclusion
CSX Corporation has demonstrated resilience in an evolving market landscape, with stock prices recovering significantly from earlier lows. The advanced retracement suggests strong investor confidence and potential for continued upward movement, barring unforeseen market disruptions. As economic conditions favor rail transport, CSX is poised for potential gains, though vigilance is warranted owing to sectoral volatility and external economic pressures.
Smart Data Insight
Master the Perfect Entry & Exit for this Stock
Don't leave your profits to chance. Historically, this stock follows specific seasonal patterns that institutional traders use to maximize returns.
- ✅ Identify the "Golden Buying Window"
- ✅ Avoid high-risk correction cycles
- ✅ Backtested data from the last 20+ years