September 19, 2025 a 11:45 am
CSX: Fibonacci Analysis - CSX Corporation
The CSX Corporation stock has experienced a fluctuating period with recent gains, indicating a potential bullish sentiment. In a company providing essential rail-based freight transportation services, such movements can significantly impact investor decisions, particularly considering their expansive network east of the Mississippi River. CSX's position in the intermodal transport and coal export sectors provides it with strategic leverage, potentially enhancing its market resilience.
Fibonacci Analysis
| Metrics | Data | ||||||||||||
|---|---|---|---|---|---|---|---|---|---|---|---|---|---|
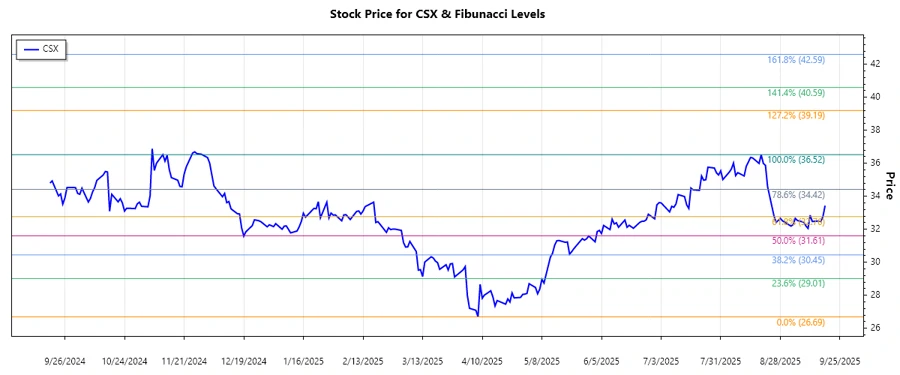
| Trend Start Date | 2025-04-08 | ||||||||||||
| Trend End Date | 2025-09-18 | ||||||||||||
| High Price (Date) | 36.52 (2025-08-19) | ||||||||||||
| Low Price (Date) | 26.69 (2025-04-08) | ||||||||||||
| Fibonacci Levels |
|
||||||||||||
| Current Price | 33.43 (as of 2025-09-18) | ||||||||||||
| Current Retracement Zone | 0.382 - 0.5 | ||||||||||||
| Technical Interpretation | The current price is in the 0.382 - 0.5 retracement zone, suggesting a potential support level, indicating buyers might step in. |
Conclusion
In conclusion, the CSX Corporation stock shows signs of stabilizing within important Fibonacci retracement levels. While the presence of support zones suggests potential for upward movement, external factors such as economic conditions and sector performance may influence momentum. This mixed technical signal calls for cautious optimism. Analysts are advised to monitor the stock's performance closely, paying attention to breakout signals or shifts in trend. The company's strategic positioning in freight transport may continue to attract investor interest, bolstered by recent infrastructure developments. However, competition and regulatory changes remain pertinent risks.
Smart Data Insight
Master the Perfect Entry & Exit for this Stock
Don't leave your profits to chance. Historically, this stock follows specific seasonal patterns that institutional traders use to maximize returns.
- ✅ Identify the "Golden Buying Window"
- ✅ Avoid high-risk correction cycles
- ✅ Backtested data from the last 20+ years