April 24, 2026 a 12:46 pm

CSX: Dividend Analysis - CSX Corporation
The CSX Corporation presents a stable dividend profile, underscored by a consistent distribution history and steady growth. With a dividend yield of over 1.24% and a history of 46 years, CSX demonstrates reliability in returning value to its shareholders. The company's moderate payout ratios indicate a balanced approach to retaining earnings and rewarding investors, while its historical dividend growth underscores its commitment to increasing shareholder value over time.
📊 Overview
CSX Corporation operates within a robust sector characterized by stable revenue flows, allowing for predictable dividend distributions. The current dividend yield of 1.24% situates the company within a competitive range, particularly given its substantial dividend history of 46 years without any reductions.
| Metric | Value |
|---|---|
| Sector | Transportation |
| Dividend yield | 1.24% |
| Current dividend per share | 0.52 USD |
| Dividend history | 46 years |
| Last cut or suspension | None |
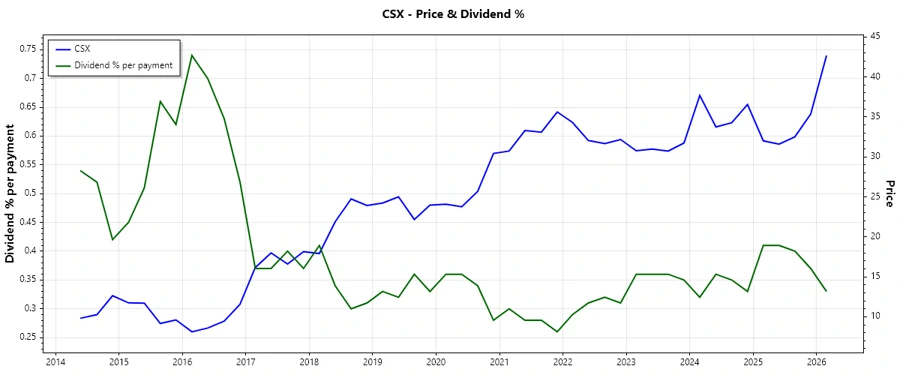
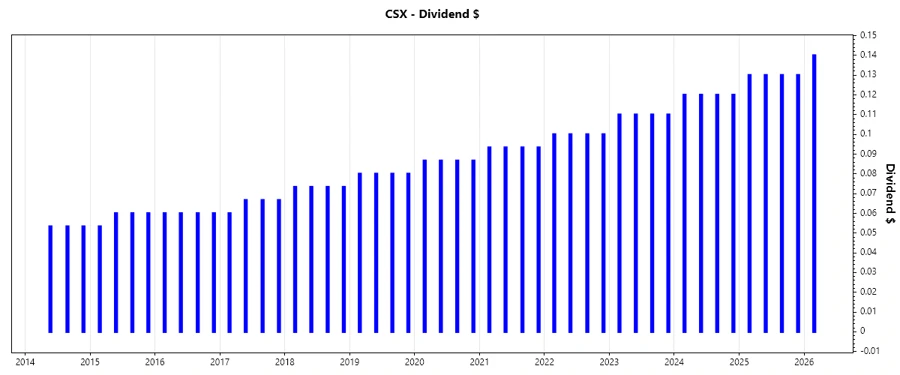
🗣️ Dividend History
The history of dividend payments is a critical factor for predicting future performance. CSX's consistent payment history makes it an attractive choice for dividend-focused investors aiming for long-term income.
| Year | Dividend Per Share (USD) |
|---|---|
| 2026 | 0.14 |
| 2025 | 0.52 |
| 2024 | 0.48 |
| 2023 | 0.44 |
| 2022 | 0.40 |
📈 Dividend Growth
Dividend growth is essential for protecting purchasing power over time, and CSX exhibits moderate growth rates, providing investors with potential income increases in the medium term.
| Time | Growth |
|---|---|
| 3 years | 9.14% |
| 5 years | 8.45% |
The average dividend growth is 8.45% over 5 years. This shows moderate but steady dividend growth.
✅ Payout Ratio
A healthy payout ratio ensures that the company is not overextending itself by distributing dividends, implying the sustainability of future payments.
| Key figure | Ratio |
|---|---|
| EPS-based | 31.80% |
| Free cash flow-based | 21.12% |
The company's payout ratios, at 31.80% (EPS) and 21.12% (FCF), indicate a conservative stance in distributing dividends, balancing between investor returns and retaining earnings for growth.
📉 Cashflow & Capital Efficiency
Evaluating cash flow generation and capital efficiency helps assess the company's ability to fund dividends and grow organically. CSX's metrics suggest good operational performance with sufficient leverage to finance activities and reward shareholders.
| Metric | 2023 | 2024 | 2025 |
|---|---|---|---|
| Free Cash Flow Yield | 4.68% | 4.35% | 2.53% |
| Earnings Yield | 5.27% | 5.55% | 4.28% |
| CAPEX to Operating Cash Flow | 40.93% | 48.20% | 62.91% |
| Stock-based Compensation to Revenue | 0.00% | 0.28% | 0.00% |
| Free Cash Flow / Operating Cash Flow Ratio | 59.07% | 51.80% | 37.09% |
This demonstrates CSX's ability to maintain a solid cash flow while investing in future growth, ensuring stakeholders benefit from both stability and potential appreciation.
⚠️ Balance Sheet & Leverage Analysis
Assessing leverage and balance sheet strength is vital for understanding risk profiles, particularly in volatile market conditions. CSX's data indicates sound financial health with sufficient coverage for its liabilities.
| Metric | 2023 | 2024 | 2025 |
|---|---|---|---|
| Debt-to-Equity | 1.59 | 1.52 | 1.47 |
| Debt-to-Assets | 45.07% | 44.40% | 44.30% |
| Debt-to-Capital | 61.36% | 60.30% | 59.52% |
| Net Debt to EBITDA | 2.43 | 2.55 | 3.18 |
| Current Ratio | 1.04 | 0.86 | 0.81 |
| Quick Ratio | 0.91 | 0.73 | 0.69 |
| Financial Leverage | 3.52 | 3.42 | 3.32 |
The company's leverage metrics are within manageable levels, indicating an ability to meet obligations and maintain operational liquidity without compromising on growth initiatives.
🔍 Fundamental Strength & Profitability
Key profitability and margin ratios help determine overall efficiency and yield potential. CSX's profitability trends underscore its operational success and margin resilience, essential for sustaining long-term dividends.
| Metric | 2023 | 2024 | 2025 |
|---|---|---|---|
| Return on Equity | 30.62% | 27.76% | 21.95% |
| Return on Assets | 8.69% | 8.11% | 6.61% |
| Margins: Net | 25.03% | 23.87% | 20.50% |
| EBIT Margin | 38.47% | 37.05% | 32.57% |
| EBITDA Margin | 49.63% | 48.65% | 41.63% |
| Gross Margin | 38.23% | 37.87% | 33.25% |
| Research & Development to Revenue | 0% | 0% | 0% |
CSX's robust margins indicate a strong ability to convert revenue into profits, supporting its dividend payouts while also reinvesting for future growth.
🚀 Price Development
📊 Dividend Scoring System
| Criteria | Score | Score Bar |
|---|---|---|
| Dividend yield | 3 | |
| Dividend Stability | 5 | |
| Dividend growth | 4 | |
| Payout ratio | 5 | |
| Financial stability | 4 | |
| Dividend continuity | 5 | |
| Cashflow Coverage | 4 | |
| Balance Sheet Quality | 3 |
Overall Score: 33/40
🗣️ Rating
CSX Corporation exhibits a solid dividend portfolio backed by strong historical performance and financial health. With a commendable growth trend and sustainable payout ratios, CSX offers a reliable source of income for dividend-focused investors, earning a strong buy recommendation for those seeking a balanced combination of income and growth potential.
Smart Data Insight
Master the Perfect Entry & Exit for this Stock
Don't leave your profits to chance. Historically, this stock follows specific seasonal patterns that institutional traders use to maximize returns.
- ✅ Identify the "Golden Buying Window"
- ✅ Avoid high-risk correction cycles
- ✅ Backtested data from the last 20+ years