
July 10, 2026 a 06:44 am
CSGP: Fibonacci Analysis - CoStar Group, Inc.
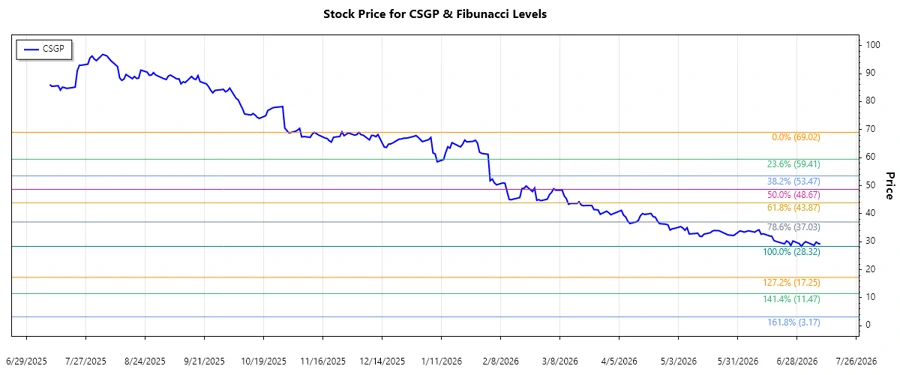
CoStar Group, Inc. (CSGP) has experienced a significant downtrend over the analyzed period. The company's extensive suite of real estate data platforms and online marketplaces is under pressure due to the recent market dynamics. The stock reached a high of $69.02 in December 2025 and has recently trended downwards, marking a low in July 2026. Investors might consider these Fibonacci levels to identify potential support areas for future buying opportunities.
Fibonacci Analysis
| Detail | Information |
|---|---|
| Start Date | 2025-12-03 |
| End Date | 2026-07-09 |
| High Point | $69.02 on 2025-12-03 |
| Low Point | $28.32 on 2026-06-30 |
| Fibonacci Level | Price Level |
|---|---|
| 0.236 | $42.06 |
| 0.382 | $48.40 |
| 0.5 | $54.38 |
| 0.618 | $60.36 |
| 0.786 | $66.77 |
Currently, the stock is hovering around the $29 range, which is below the 0.236 Fibonacci retracement level, indicating that the stock has not yet entered a retracement zone.
Technically, this suggests potential further downside before the stock finds a significant support level that could trigger a buying opportunity or a reversal.
Conclusion
The CoStar Group, Inc.'s stock demonstrates a significant downward trend, raising concerns among investors regarding its short-term outlook. Despite the company's robust real estate data services and online presence, market factors have influenced its price drastically. The failure to maintain above any key Fibonacci retracement level implies that the bearish momentum may persist, suggesting caution. Investors could see this as a chance to observe deeper support levels before making decisions. Analysts will monitor whether upcoming economic reports or internal strategies from CoStar can alter its current trajectory positively. While opportunities might arise at lower prices, risks remain until there's clear evidence of a reversal or stabilization within the indicated zones.
Smart Data Insight
Master the Perfect Entry & Exit for this Stock
Don't leave your profits to chance. Historically, this stock follows specific seasonal patterns that institutional traders use to maximize returns.
- ✅ Identify the "Golden Buying Window"
- ✅ Avoid high-risk correction cycles
- ✅ Backtested data from the last 20+ years