June 12, 2025 a 11:44 am

CSCO: Fibonacci Analysis - Cisco Systems, Inc.
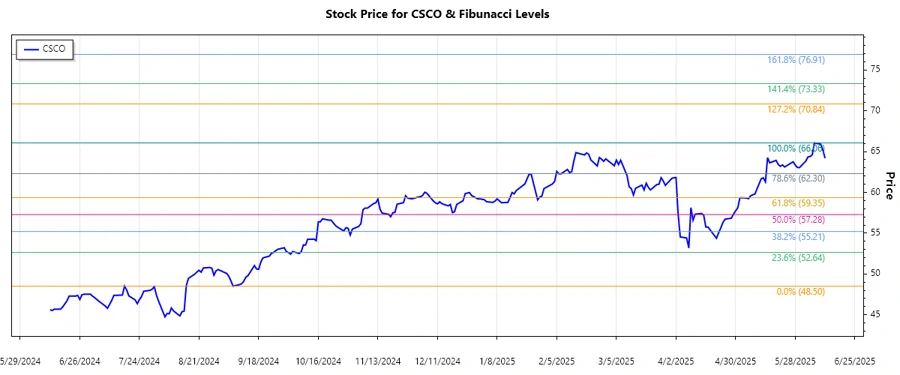
Cisco Systems, Inc. has shown a dominant uptrend in recent months, reflecting investor confidence in its robust networking and communications technology offerings. The company's strategic alliances and broad service portfolio position it well for sustained growth. With the stock showing strong upward momentum, technical analysis tools like Fibonacci retracement can provide insights into potential future movements.
Fibonacci Analysis
| Trend Start Date | Trend End Date | High Price (Date) | Low Price (Date) |
|---|---|---|---|
| 2024-09-06 | 2025-06-11 | 66.06 (2025-06-06) | 48.5 (2024-09-06) |
| Fibonacci Level | Price Level |
|---|---|
| 0.236 | 59.55 |
| 0.382 | 56.61 |
| 0.5 | 54.28 |
| 0.618 | 51.95 |
| 0.786 | 48.82 |
The current price is within the 0.236 retracement level, indicating a possible retracement zone. This level could act as a support for future price movements, suggesting potential buying opportunities for traders.
Conclusion
Cisco's stock has demonstrated a strong uptrend, which reflects the market's positive outlook on the company’s capacity to innovate and adapt in the rapidly changing tech landscape. The recent retracement to the 0.236 level suggests a potential for continuation of the upward trend. However, investors should be aware of broader market conditions and Cisco's strategic execution when considering potential investments. Overall, the technical indicators suggest that Cisco remains a viable player in the technology sector with potential for growth.
Smart Data Insight
Master the Perfect Entry & Exit for this Stock
Don't leave your profits to chance. Historically, this stock follows specific seasonal patterns that institutional traders use to maximize returns.
- ✅ Identify the "Golden Buying Window"
- ✅ Avoid high-risk correction cycles
- ✅ Backtested data from the last 20+ years