June 01, 2026 a 03:31 pm


CSCO: Dividend Analysis - Cisco Systems, Inc.
Cisco Systems, Inc. presents a promising yet moderate dividend profile. With a solid history of dividends over 16 years and a gradual but steady growth, it remains a reliable choice for income-focused investors. The company's stable payout ratios and financial stability further enhance its attractiveness for dividend investors.
📊 Overview
Cisco Systems, Inc. operates within the technology sector, offering a dividend yield of 1.38%. With a current dividend per share standing at 1.62 USD, the company has delivered dividends consistently over 16 years. Importantly, there hasn't been any recent cut or suspension in its dividend policy.
| Sector | Dividend Yield | Current Dividend Per Share | Dividend History Years | Last Cut or Suspension |
|---|---|---|---|---|
| Technology | 1.38% | 1.62 USD | 16 years | None |
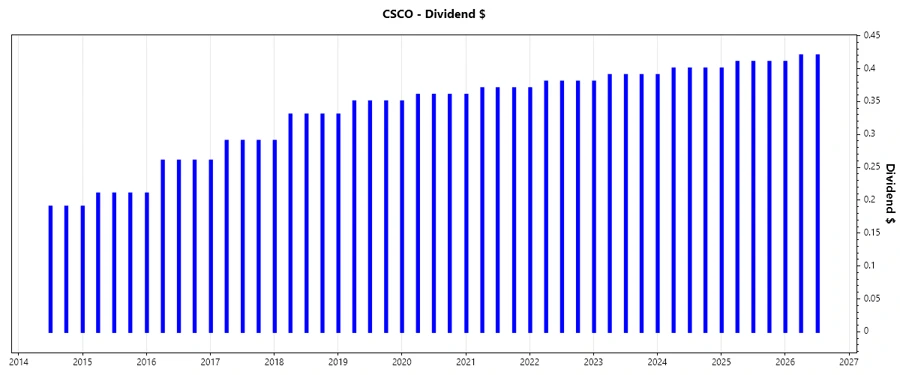
📈 Dividend History
The dividend history of Cisco underscores its commitment to returning capital to shareholders. Dividends serve as a vital metric in evaluating a company's profitability and financial health over time. The consistently increasing dividends reflect Cisco's robust financial performance.
| Year | Dividend Per Share (USD) |
|---|---|
| 2026 | 1.25 |
| 2025 | 1.63 |
| 2024 | 1.59 |
| 2023 | 1.55 |
| 2022 | 1.51 |
📉 Dividend Growth
Analyzing the dividend growth gives insight into the potential future dividend payments. Stable growth is a positive indicator of a company's future performance.
| Time | Growth |
|---|---|
| 3 years | 2.58% |
| 5 years | 2.65% |
The average dividend growth is 2.65% over 5 years. This shows moderate but steady dividend growth.
✅ Payout Ratio
The payout ratio is crucial in assessing how much of a company's earnings are being returned to shareholders. A balanced ratio indicates prudent financial management while maintaining shareholder returns.
| Key Figure | Ratio |
|---|---|
| EPS-based | 53.53% |
| Free Cash Flow-based | 50.58% |
The EPS-based payout ratio of 53.53% and FCF ratio of 50.58% imply sustainable dividend distributions without over-leveraging the company.
Cashflow & Capital Efficiency
Evaluating cash flow and capital efficiency helps in understanding Cisco's ability to maintain and grow dividends efficiently.
| Year | Free Cash Flow Yield | Earnings Yield | Capex / Operating Cash Flow | Stock Compensation / Revenue | Free Cash Flow / Operating Cash Flow |
|---|---|---|---|---|---|
| 2025 | 4.87% | 3.73% | 6.38% | 6.43% | 93.62% |
| 2024 | 5.27% | 5.33% | 6.16% | 5.71% | 93.84% |
| 2023 | 8.93% | 5.92% | 4.27% | 4.13% | 95.73% |
Cisco's cash flow efficiency, demonstrated by a consistently high Free Cash Flow / Operating Cash Flow ratio, shows the company's strong capacity to cover its dividends from cash flows.
⚠️ Balance Sheet & Leverage Analysis
Cisco's leverage ratios and balance sheet metrics illustrate its overall financial stability, ensuring the company can handle its debt while responsibly managing its capital structure.
| Year | Debt to Equity | Debt to Assets | Debt to Capital | Net Debt to EBITDA | Current Ratio | Quick Ratio | Financial Leverage |
|---|---|---|---|---|---|---|---|
| 2025 | 0.60 | 0.23 | 0.37 | 1.28 | 1.00 | 0.91 | 2.61 |
| 2024 | 0.68 | 0.25 | 0.41 | 1.49 | 0.91 | 0.83 | 2.74 |
| 2023 | 0.19 | 0.08 | 0.16 | -0.10 | 1.38 | 1.27 | 2.30 |
Cisco's particular strength in debt management, indicated by the low debt-to-equity ratio, assures its capacity to pursue possible growth opportunities efficiently.
Fundamental Strength & Profitability
The profitability ratios reflect Cisco's efficiency and capacity to convert sales into actual profit, affecting dividend sustainability and growth potential.
| Year | ROE | ROA | Net Margin | EBIT Margin | EBITDA Margin | Gross Margin | R&D / Revenue |
|---|---|---|---|---|---|---|---|
| 2025 | 21.73% | 8.32% | 17.97% | 22.09% | 27.14% | 64.94% | 16.42% |
| 2024 | 22.70% | 8.29% | 19.18% | 24.61% | 29.27% | 64.73% | 14.84% |
| 2023 | 28.44% | 12.38% | 22.13% | 27.62% | 30.65% | 62.73% | 13.25% |
Strong profitability margins and a high return on equity indicate the company's strong operational management and robust financial health, key drivers for potential dividend increases.
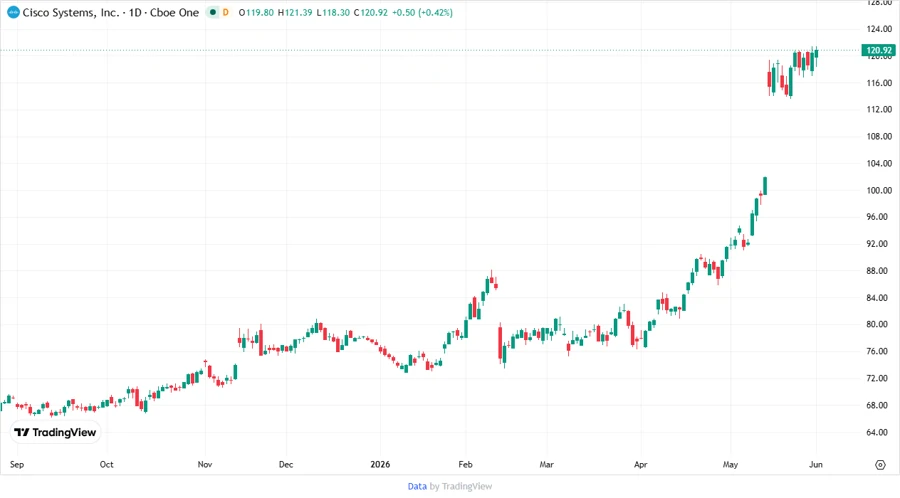
📌 Price Development
Dividend Scoring System
| Category | Score | Indicator |
|---|---|---|
| Dividend yield | 3 | |
| Dividend stability | 4 | |
| Dividend growth | 3 | |
| Payout ratio | 3 | |
| Financial stability | 4 | |
| Dividend continuity | 4 | |
| Cashflow Coverage | 4 | |
| Balance Sheet Quality | 5 |
Total Score: 30/40
Final Rating
Cisco Systems, Inc. proves to be a strong candidate for dividend-focused portfolios, offering investors a blend of financial stability, steady growth, and a manageable payout ratio. Its strong balance sheet and continuing history of dividend payouts make it a reliable choice for income-seeking investors, albeit with a moderate growth profile.
Smart Data Insight
Master the Perfect Entry & Exit for this Stock
Don't leave your profits to chance. Historically, this stock follows specific seasonal patterns that institutional traders use to maximize returns.
- ✅ Identify the "Golden Buying Window"
- ✅ Avoid high-risk correction cycles
- ✅ Backtested data from the last 20+ years