
May 26, 2026 a 07:46 am
CSCO: Dividend Analysis - Cisco Systems, Inc.
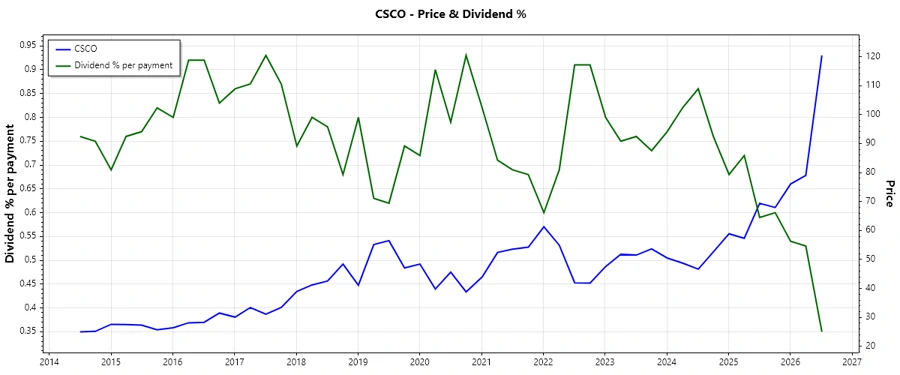
Cisco Systems, Inc., a prominent player in the technology sector, offers investors a steady dividend yield. With a historical record of 16 consecutive years of dividend payments, Cisco's current yield stands at 1.38%. Despite moderate growth rates, the stability and consistency of payouts reassure dividend-focused investors.
📊 Overview
Cisco Systems, Inc. has demonstrated a resilient dividend strategy evident through its consistent dividend payments over a significant period. The firm's financial health contributes to sustained payouts, with metrics reflecting a stable payout ratio and a growing dividend per share. This stability affords investors peace of mind regarding income certainty.
| Factor | Value |
|---|---|
| Sector | Technology |
| Dividend Yield | 1.38% |
| Current Dividend Per Share | $1.62 USD |
| Dividend History | 16 years |
| Last Cut or Suspension | None |
🗣️ Dividend History
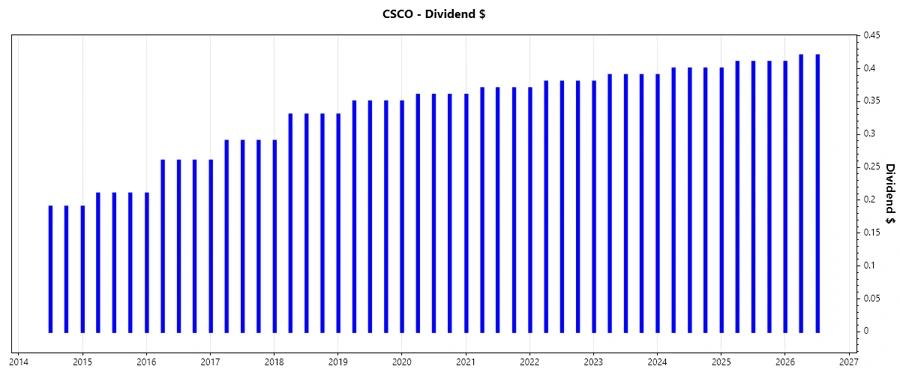
Cisco's dividend history underscores its commitment to returning value to shareholders. The regular payment enhances investor confidence, underscoring the company's profitability and strategic financial management.
| Year | Dividend Per Share (USD) |
|---|---|
| 2026 | 1.25 |
| 2025 | 1.63 |
| 2024 | 1.59 |
| 2023 | 1.55 |
| 2022 | 1.51 |
📈 Dividend Growth
The growth of Cisco's dividend over the years indicates a commitment to increasing shareholder returns. A stable growth trajectory reflects healthy earnings and enhances investor expectations.
| Time | Growth |
|---|---|
| 3 years | 2.58% |
| 5 years | 2.65% |
The average dividend growth is 2.65% over 5 years. This shows moderate but steady dividend growth.
📉 Payout Ratio
The payout ratio informs investors about the portion of earnings paid out as dividends. Cisco's current payout ratios suggest a balanced approach, maintaining dividend affordability while supporting reinvestment strategies.
| Key Figure | Ratio |
|---|---|
| EPS-based | 53.53% |
| Free Cash Flow-based | 50.58% |
With EPS-based ratio at 53.53% and FCF-based at 50.58%, Cisco balances rewarding shareholders and preserving capital for growth initiatives.
✅ Cashflow & Capital Efficiency
Cash flow metrics provide insights into Cisco's operational efficiency and its ability to fund dividends. These indicators show that Cisco effectively manages capital expenditure relative to its operating cash flow, reinforcing dividend sustainability.
| Measure | 2025 | 2024 | 2023 |
|---|---|---|---|
| Free Cash Flow Yield | 4.87% | 5.27% | 8.93% |
| Earnings Yield | 3.73% | 5.33% | 5.92% |
| CAPEX to Operating Cash Flow | 6.38% | 6.16% | 4.27% |
| Stock-based Compensation to Revenue | 6.40% | 5.71% | 4.13% |
| Free Cash Flow / Operating Cash Flow Ratio | 93.62% | 93.84% | 95.73% |
| Return on Invested Capital | 11.67% | 10.80% | 17.12% |
The robust cash flow and efficient capital allocation strategies ensure Cisco can sustain and potentially grow dividends moving forward.
⚠️ Balance Sheet & Leverage Analysis
Examining the balance sheet highlights Cisco’s capability to manage its debt levels, with debt ratios pointing to a controlled leverage position. The firm's financial stability is evident through a healthy debt-to-equity ratio.
| Measure | 2025 | 2024 | 2023 |
|---|---|---|---|
| Debt-to-Equity | 0.60 | 0.68 | 0.19 |
| Debt-to-Assets | 0.23 | 0.25 | 0.08 |
| Debt-to-Capital | 0.37 | 0.41 | 0.16 |
| Net Debt to EBITDA | 1.28 | 1.49 | -0.10 |
| Current Ratio | 0.99 | 0.91 | 1.38 |
| Quick Ratio | 0.91 | 0.83 | 1.27 |
| Financial Leverage | 2.61 | 2.74 | 2.30 |
Cisco's prudent financial management reflects strong liquidity positions and manageable debt obligations, yet room for improvement remains in provisions for unexpected downturns.
🕵️♀️ Fundamental Strength & Profitability
Assessment of Cisco's profitability reveals robust margins and returns, indicative of competitive operational efficiencies and strong market positioning. These indicators are crucial for long-term dividend viability.
| Measure | 2025 | 2024 | 2023 |
|---|---|---|---|
| Return on Equity | 21.73% | 22.70% | 28.44% |
| Return on Assets | 8.32% | 8.29% | 12.38% |
| Net Profit Margin | 17.97% | 19.18% | 22.13% |
| EBIT Margin | 22.09% | 24.61% | 27.62% |
| EBITDA Margin | 27.14% | 29.27% | 30.65% |
| Gross Profit Margin | 64.94% | 64.73% | 62.73% |
| R&D to Revenue | 16.42% | 14.84% | 13.25% |
Cisco's strong profit margins and returns on investments demonstrate a competitive edge and underpin ongoing dividend payouts.
🔍 Price Development
📋 Dividend Scoring System
| Category | Score | Bar |
|---|---|---|
| Dividend Yield | 3 | |
| Dividend Stability | 4 | |
| Dividend Growth | 3 | |
| Payout Ratio | 4 | |
| Financial Stability | 4 | |
| Dividend Continuity | 4 | |
| Cashflow Coverage | 4 | |
| Balance Sheet Quality | 3 |
Total Score: 29/40
🧾 Rating
Conclusively, Cisco Systems, Inc. presents a compelling option for income-focused investors. A reliable dividend yield coupled with moderate growth and sound financial health support ongoing returns. Investors may consider Cisco's consistent track record and operational stability in making long-term investment decisions.
Smart Data Insight
Master the Perfect Entry & Exit for this Stock
Don't leave your profits to chance. Historically, this stock follows specific seasonal patterns that institutional traders use to maximize returns.
- ✅ Identify the "Golden Buying Window"
- ✅ Avoid high-risk correction cycles
- ✅ Backtested data from the last 20+ years