
May 07, 2026 a 02:46 am

CSCO: Dividend Analysis - Cisco Systems, Inc.
Cisco Systems, Inc., a leader in networking solutions, shows a solid dividend profile with a steady yield supported by a robust history of payments. Their financials demonstrate a balanced approach with room for growth in their dividend policy, reflecting a commitment to shareholder returns. The payout ratios remain comfortable, indicating their capacity to sustain and potentially enhance dividend distributions.
📊 Overview
Cisco Systems, Inc. has maintained a consistent dividend yield which is competitive within its sector, underscored by a strong track record of dividend payments over the years.
| Metric | Details |
|---|---|
| Sector | Technology |
| Dividend yield | 2.09 % |
| Current dividend per share | 1.62 USD |
| Dividend history | 16 years |
| Last cut or suspension | None |
🗣️ Dividend History
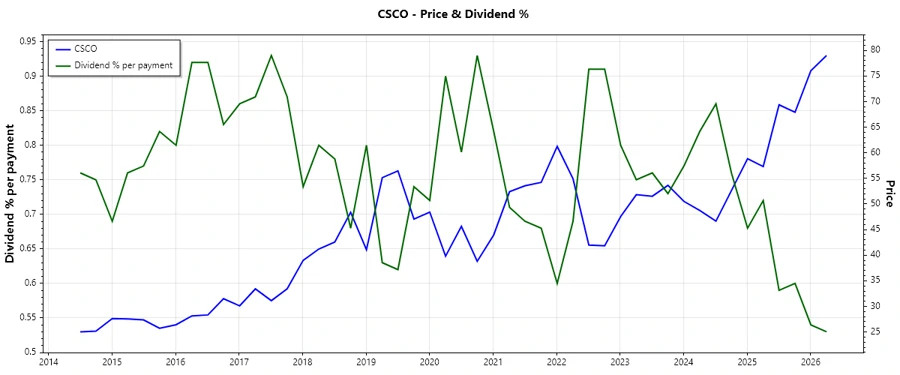
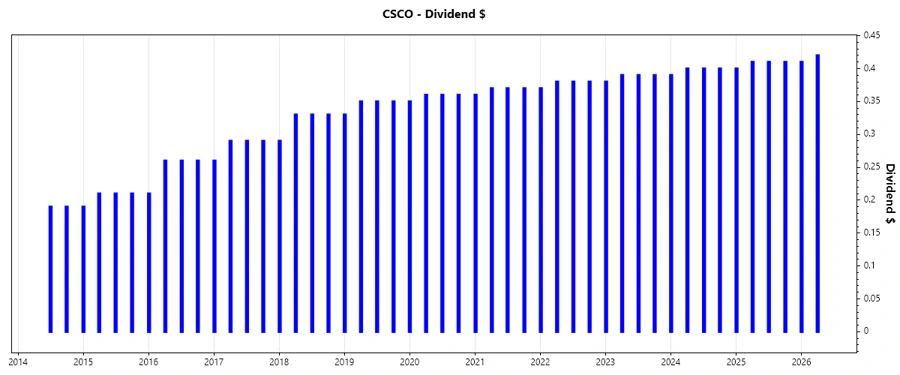
The company's commitment towards its shareholders is visible from its consistent dividend distributions. This history instills confidence in investors and is a testament to Cisco's financial resilience.
| Year | Dividend per Share (USD) |
|---|---|
| 2026 | 0.83 |
| 2025 | 1.63 |
| 2024 | 1.59 |
| 2023 | 1.55 |
| 2022 | 1.51 |
📈 Dividend Growth
Tracking dividend growth is crucial as it reflects the company's earnings strength and the management's commitment to distribute wealth among shareholders.
| Time | Growth |
|---|---|
| 3 years | 2.58 % |
| 5 years | 2.65 % |
The average dividend growth is 2.65% over 5 years. This shows moderate but steady dividend growth, suggesting confidence in future earnings stability.
⚠️ Payout Ratio
The dividend payout ratio provides insight into how much of the company's earnings are being returned to shareholders as dividends, compared to what is retained in the business for growth.
| Key figure | Ratio |
|---|---|
| EPS-based | 57.81 % |
| Free cash flow-based | 49.78 % |
The payout ratios indicate a sustainable level with room for maintaining the current dividend policy. The EPS-based ratio at 57.81% ensures sufficient reinvestment into the company, while the FCF ratio at 49.78% shows sufficient cash flow coverage.
💰 Cashflow & Capital Efficiency
Evaluating cash flow metrics helps to understand Cisco's ability to cover dividend payouts, invest in growth, and improve shareholder value.
| Metric | 2023 | 2024 | 2025 |
|---|---|---|---|
| Free Cash Flow Yield | 8.93 % | 5.27 % | 4.87 % |
| Earnings Yield | 5.92 % | 5.33 % | 3.73 % |
| CAPEX to Operating Cash Flow | 4.27 % | 6.16 % | 6.38 % |
| Stock-based Compensation to Revenue | 4.13 % | 5.71 % | 6.43 % |
| Free Cash Flow / Operating Cash Flow Ratio | 95.73 % | 93.84 % | 93.62 % |
| Return on Invested Capital | 17.12 % | 10.80 % | 11.66 % |
Cash flow metrics suggest strong operational efficiency and capability to cover dividends and fund future investments, marking it as financially sound.
⚖️ Balance Sheet & Leverage Analysis
Balance sheet analysis addresses Cisco's leverage and ability to meet its long-term obligations, which influences its dividend reliability.
| Metric | 2023 | 2024 | 2025 |
|---|---|---|---|
| Debt-to-Equity | 0.19 | 0.68 | 0.60 |
| Debt-to-Assets | 0.08 | 0.25 | 0.23 |
| Debt-to-Capital | 0.16 | 0.41 | 0.37 |
| Net Debt to EBITDA | -0.10 | 1.49 | 1.28 |
| Current Ratio | 1.38 | 0.91 | 1.00 |
| Quick Ratio | 1.27 | 0.83 | 0.91 |
| Financial Leverage | 2.30 | 2.74 | 2.61 |
Cisco's leverage ratios remain within industry norms, supporting a robust capital structure capable of sustaining its dividend policy.
🏦 Fundamental Strength & Profitability
This section highlights Cisco's profitability and efficiency, critical for sustaining its dividend payments and operational prowess.
| Metric | 2023 | 2024 | 2025 |
|---|---|---|---|
| Return on Equity | 28.44 % | 22.70 % | 21.73 % |
| Return on Assets | 12.38 % | 8.29 % | 8.32 % |
| Net Margin | 22.13 % | 19.18 % | 17.97 % |
| EBIT Margin | 27.62 % | 24.61 % | 22.09 % |
| EBITDA Margin | 30.65 % | 29.27 % | 27.14 % |
| Gross Margin | 62.73 % | 64.73 % | 64.94 % |
| Research & Development to Revenue | 13.25 % | 14.84 % | 16.42 % |
Cisco exhibits strong profitability indicators, reinforcing its capacity to maintain dividend stability and operational competitiveness.
📉 Price Development
✅ Dividend Scoring System
| Criteria | Score | Overview |
|---|---|---|
| Dividend yield | 4 | |
| Dividend Stability | 5 | |
| Dividend growth | 3 | |
| Payout ratio | 4 | |
| Financial stability | 4 | |
| Dividend continuity | 5 | |
| Cashflow Coverage | 5 | |
| Balance Sheet Quality | 4 |
Overall Score: 34/40
📝 Rating
Based on the analysis, Cisco Systems, Inc. maintains a strong dividend profile with a steady yield, sound financial structure, and consistent dividend growth. Its profitability and balance sheet metrics reinforce its capacity to sustain and potentially grow dividends, making it an attractive proposition for income-focused investors.
Smart Data Insight
Master the Perfect Entry & Exit for this Stock
Don't leave your profits to chance. Historically, this stock follows specific seasonal patterns that institutional traders use to maximize returns.
- ✅ Identify the "Golden Buying Window"
- ✅ Avoid high-risk correction cycles
- ✅ Backtested data from the last 20+ years