October 13, 2025 a 07:46 am


CSCO: Dividend Analysis - Cisco Systems, Inc.
The dividend analysis of Cisco Systems, Inc. reveals a solid investment opportunity with a reasonable dividend yield and stable dividend growth. With a robust payout ratio and steady financials, Cisco demonstrates an attractive balance between income generation and growth potential. Despite financial market volatilities, Cisco’s dividend practices underscore its reliability and commitment to shareholders.
📊 Overview
Cisco Systems operates within a competitive sector yet maintains a stable dividend history and offers moderate yield.
| Factor | Detail |
|---|---|
| Sector | Networking Technology |
| Dividend yield | 2.40 % |
| Current dividend per share | 1.62 USD |
| Dividend history | 15 years |
| Last cut or suspension | None |
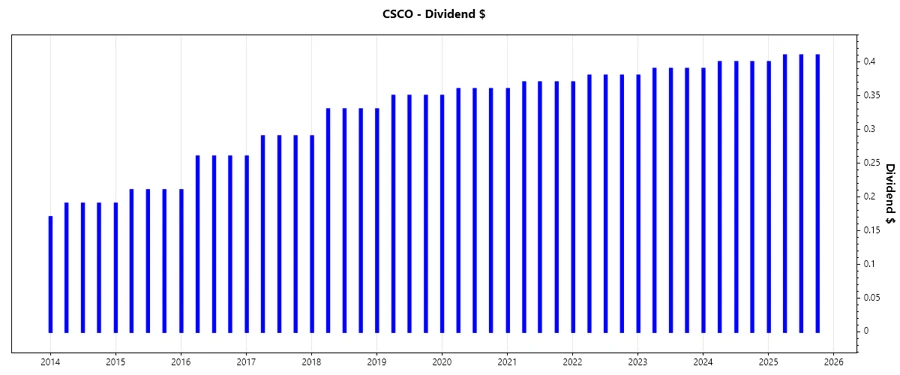
📈 Dividend History
With a 15-year history of dividend payments, Cisco’s dividend stability is crucial for investors relying on steady income. Dividends reported annually showcase a commitment to returning value to investors.
| Year | Dividend Per Share (USD) |
|---|---|
| 2025 | 1.63 |
| 2024 | 1.59 |
| 2023 | 1.55 |
| 2022 | 1.51 |
| 2021 | 1.47 |
📉 Dividend Growth
Dividend growth is essential for maintaining purchasing power. Cisco exhibits consistent growth in dividends over time.
| Time | Growth |
|---|---|
| 3 years | 2.65 % |
| 5 years | 2.87 % |
The average dividend growth is 2.87 % over 5 years. This shows moderate but steady dividend growth.
🗣️ Payout Ratio
The payout ratio helps assess the sustainability of dividend payments by indicating what portion of earnings are used to cover dividends.
| Key figure | Ratio |
|---|---|
| EPS-based | 61.33 % |
| Free cash flow-based | 48.16 % |
With a 61.33 % EPS-based payout ratio and 48.16 % FCF-based, Cisco demonstrates a balanced approach, indicating prudent dividend sustainability against earnings and cash flows.
✅ Cashflow & Capital Efficiency
Cash flow metrics reveal the operational efficiency and sustainability of dividend practices.
| Measure | 2025 | 2024 | 2023 |
|---|---|---|---|
| Free Cash Flow Yield | 4.87 % | 5.27 % | 8.93 % |
| Earnings Yield | 3.83 % | 5.33 % | 5.91 % |
| CAPEX to Operating Cash Flow | 6.38 % | 6.16 % | 4.27 % |
| Stock-based Compensation to Revenue | 6.43 % | 5.71 % | 4.13 % |
| Free Cash Flow / Operating Cash Flow Ratio | 93.62 % | 93.84 % | 95.73 % |
These metrics indicate strong cash flow generation and capital efficiency, crucial for sustaining dividend payments and future capital investments.
⚠️ Balance Sheet & Leverage Analysis
The balance sheet analysis highlights Cisco's leverage and financial stability, essential for long-term dividend commitments.
| Measure | 2025 | 2024 | 2023 |
|---|---|---|---|
| Debt-to-Equity | 63.28 % | 70.91 % | 21.22 % |
| Debt-to-Assets | 24.24 % | 25.91 % | 9.24 % |
| Debt-to-Capital | 38.76 % | 41.49 % | 17.50 % |
| Net Debt to EBITDA | 1.27 | 1.47 | -0.05 |
| Current Ratio | 1.00 | 0.91 | 1.38 |
| Quick Ratio | 0.91 | 0.83 | 1.27 |
| Financial Leverage | 2.61 | 2.74 | 2.30 |
Cisco's leverage ratios signify a manageable debt profile, which increases its capability to maintain dividend practices in challenging economic times.
🌟 Fundamental Strength & Profitability
Analyzing fundamental strength offers insights into Cisco's ability to generate earnings and maintain profitability.
| Measure | 2025 | 2024 | 2023 |
|---|---|---|---|
| Return on Equity | 22.31 % | 22.70 % | 28.44 % |
| Return on Assets | 8.55 % | 8.29 % | 12.38 % |
| Margins: Net | 18.45 % | 19.18 % | 22.13 % |
| Margins: EBIT | 23.03 % | 24.61 % | 27.62 % |
| Margins: EBITDA | 27.99 % | 29.27 % | 30.65 % |
| Research & Development to Revenue | 16.42 % | 14.84 % | 13.25 % |
Impressive profitability and strong returns on equity and assets underscore Cisco's competitive advantage and capability to maintain dividend growth.
📉 Price Development
Understanding price movement over time provides insight into market perception of Cisco's financial health.
✅ Dividend Scoring System
| Category | Score | Score Bar |
|---|---|---|
| Dividend yield | 4 | |
| Dividend Stability | 5 | |
| Dividend growth | 3 | |
| Payout ratio | 4 | |
| Financial stability | 4 | |
| Dividend continuity | 5 | |
| Cashflow Coverage | 4 | |
| Balance Sheet Quality | 5 |
Total Score: 34/40
🗣️ Rating
Cisco Systems, Inc. reflects a robust dividend profile with consistent yields and reliable growth potential, making it a strong contender for long-term income-focused portfolios. Its balance sheet strength and consistent payout ratio ensure resilience and investor confidence. Recommended for dividend investors seeking moderate growth with reliable income potential.