July 21, 2025 a 11:31 am


CSCO: Dividend Analysis - Cisco Systems, Inc.
Cisco Systems, Inc. exhibits a strong dividend profile characterized by consistent growth and favorable financial ratios. The company's commitment to returning value to shareholders is evident through its robust dividend history and moderate payout ratios, ensuring sustainability.
📊 Overview
Cisco Systems operates in the technology sector, providing networking hardware and software solutions globally.
| Metric | Value |
|---|---|
| Sector | Technology |
| Dividend yield | 2.91 % |
| Current dividend per share | 1.58 USD |
| Dividend history | 15 years |
| Last cut or suspension | None |
📈 Dividend History
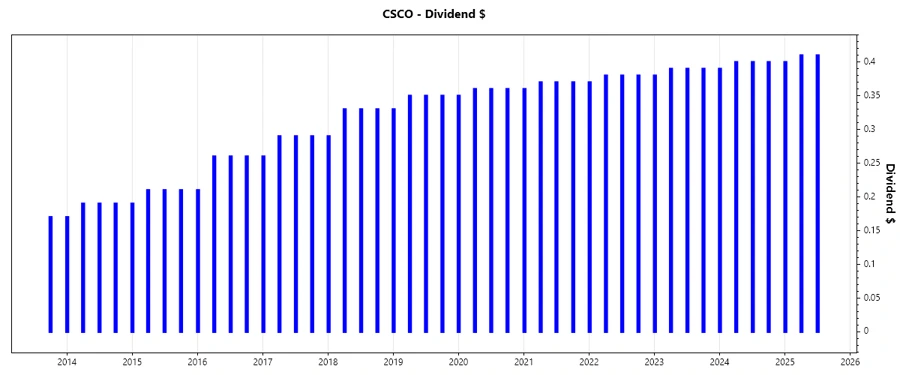
Cisco has demonstrated a consistent dividend payment history over the years, indicating a reliable track record of returning value to shareholders. This stability is crucial for income-focused investors who seek predictable income streams.
| Year | Dividend per Share |
|---|---|
| 2025 | 1.22 |
| 2024 | 1.59 |
| 2023 | 1.55 |
| 2022 | 1.51 |
| 2021 | 1.47 |
📈 Dividend Growth
The growth rate of dividends reflects the company's ability to increase payouts to shareholders over time. This is an important measure of how the company's financial health and earnings power expands, rewarding investors with growing returns.
| Time | Growth |
|---|---|
| 3 years | 2.65 % |
| 5 years | 2.87 % |
The average dividend growth is 2.87 % over 5 years. This shows moderate but steady dividend growth, appealing to investors seeking gradual appreciation.
⚠️ Payout Ratio
Payout ratios indicate the proportion of earnings and cash flow used to cover dividends, shedding light on the sustainability of the dividend and its impact on corporate reinvestment capabilities.
| Key figure | Ratio |
|---|---|
| EPS-based | 64.20 % |
| Free cash flow-based | 48.84 % |
The EPS payout ratio of 64.20 % indicates that the company is maintaining a healthy level of earnings retention, while the FCF ratio of 48.84 % suggests strong cash support for dividends.
📊 Cashflow & Capital Efficiency
Examining cash flow metrics and capital efficiency provides insights into the company's operational effectiveness and ability to finance dividends from ongoing operations.
| Year | 2024 | 2023 | 2022 |
|---|---|---|---|
| Free Cash Flow Yield | 5.27 % | 8.93 % | 6.74 % |
| Earnings Yield | 5.33 % | 5.91 % | 6.24 % |
| CAPEX to Operating Cash Flow | 6.16 % | 4.27 % | 3.60 % |
| Stock-based Compensation to Revenue | 5.71 % | 4.13 % | 3.66 % |
| Free Cash Flow / Operating Cash Flow Ratio | 93.84 % | 95.73 % | 96.39 % |
Strong cash flow generation and efficient capital allocation are evident, reflecting the company's capability of sustaining dividend payments and reinvesting in growth efficiently.
📉 Balance Sheet & Leverage Analysis
The balance sheet strength and leverage ratios provide an assessment of the corporate financial stability, liquidity, and capital structure balance.
| Year | 2024 | 2023 | 2022 |
|---|---|---|---|
| Debt-to-Equity | 0.681 | 0.189 | 0.239 |
| Debt-to-Assets | 0.249 | 0.082 | 0.101 |
| Debt-to-Capital | 0.405 | 0.159 | 0.193 |
| Net Debt to EBITDA | 1.49 | -0.10 | 0.15 |
| Current Ratio | 0.951 | 1.385 | 1.432 |
| Quick Ratio | 0.825 | 1.268 | 1.332 |
| Financial Leverage | 2.737 | 2.296 | 2.363 |
With a solid balance sheet and prudent leverage levels, Cisco is positioned for financial resilience and flexibility.
✅ Fundamental Strength & Profitability
Fundamental strength metrics highlight the company's profitability and operational efficiency, crucial for sustaining growth and competitive advantage.
| Year | 2024 | 2023 | 2022 |
|---|---|---|---|
| Return on Equity (ROE) | 22.70 % | 28.44 % | 29.70 % |
| Return on Assets (ROA) | 8.29 % | 12.38 % | 12.57 % |
| Net Profit Margin | 19.18 % | 22.13 % | 22.91 % |
| EBITDA Margin | 29.27 % | 30.65 % | 32.57 % |
| Research & Development to Revenue | 14.84 % | 13.25 % | 13.14 % |
Cisco's high return ratios and substantial profit margins reinforce its robust profitability and potential for growth.
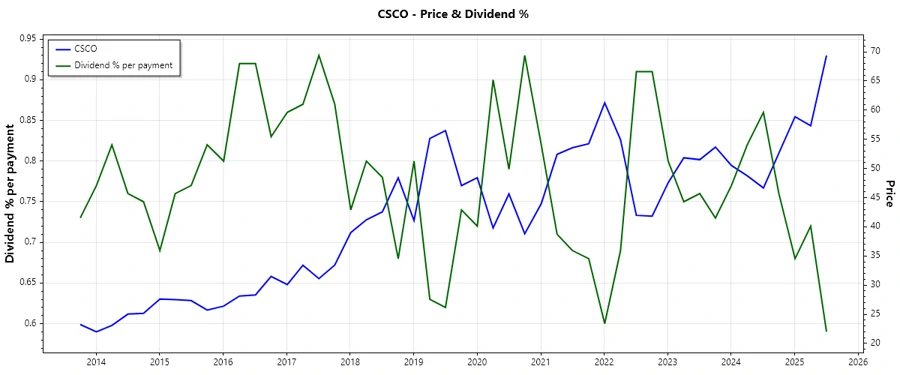
📉 Price Development
🗣️ Dividend Scoring System
| Criteria | Score | Rating |
|---|---|---|
| Dividend yield | 3 | |
| Dividend Stability | 4 | |
| Dividend growth | 3 | |
| Payout ratio | 3 | |
| Financial stability | 4 | |
| Dividend continuity | 4 | |
| Cashflow Coverage | 4 | |
| Balance Sheet Quality | 4 |
Total Score: 29/40
🗣️ Rating
Given Cisco Systems, Inc.'s strong dividend track record, moderate growth, and excellent financial stability, it is rated as a reliable choice for income-oriented investors. The company's consistent performance and sound financial management support sustained dividend payments, making it a solid investment for those looking for steady income streams.
Smart Data Insight
Master the Perfect Entry & Exit for this Stock
Don't leave your profits to chance. Historically, this stock follows specific seasonal patterns that institutional traders use to maximize returns.
- ✅ Identify the "Golden Buying Window"
- ✅ Avoid high-risk correction cycles
- ✅ Backtested data from the last 20+ years