March 02, 2026 a 03:15 pm
CRM: Fibonacci Analysis - Salesforce, Inc.
Salesforce, Inc. shares have shown significant volatility in recent months, reflecting broader sector trends in customer relationship management technology. The company’s strategic acquisitions and continued investment in its Customer 360 platform are pivotal in maintaining its competitive edge. While recent market fluctuations have impacted short-term valuation, Salesforce’s long-term potential remains robust due to its diverse service offerings and strategic market positioning.
Fibonacci Analysis
| Trend Start Date | Trend End Date | High Price (Date) | Low Price (Date) | Fibonacci Level | Price Level |
|---|---|---|---|---|---|
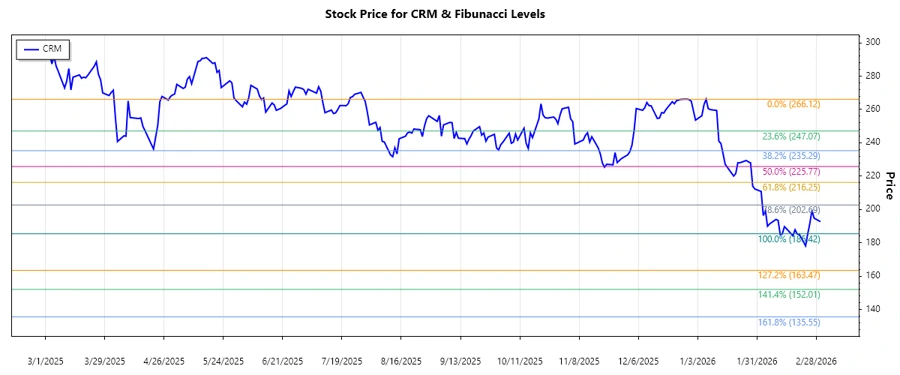
| 2025-11-12 | 2026-03-02 | 266.12 (2025-12-01) | 185.42 (2026-02-24) | 0.236 | 202.26 |
| 0.382 | 218.99 | ||||
| 0.5 | 225.87 | ||||
| 0.618 | 232.75 | ||||
| 0.786 | 247.78 | ||||
The current price is close to the 0.786 retracement level, which suggests a potential resistance point. This level can act as a critical barrier that could determine the future trend direction.
Conclusion
Salesforce, Inc. is standing at a crucial juncture as it hovers around a significant Fibonacci retracement level. The 0.786 level could serve as a pivotal resistance, potentially halting the upward correction after a recent downtrend. For investors, this means the stock may face difficulties in maintaining upward momentum unless a robust buying interest emerges beyond this critical level. Conversely, breaking past this resistance could signal further bullish potential. However, given existing market uncertainties, risk management, such as setting stop-loss orders and continuously monitoring market conditions, is advisable.