October 22, 2025 a 10:15 am
CRM: Fibonacci Analysis - Salesforce, Inc.
Salesforce, Inc. presents a compelling growth opportunity. Known for its robust Customer 360 platform, Salesforce is positioned as a market leader providing essential CRM solutions to enterprises across various industries. Despite recent volatility, the stock demonstrates potential in delivering value-driven solutions, capturing a considerable share in a growing market, and expanding in strategic technological areas like integration and analytics.
Fibonacci Analysis
| Details | Information |
|---|---|
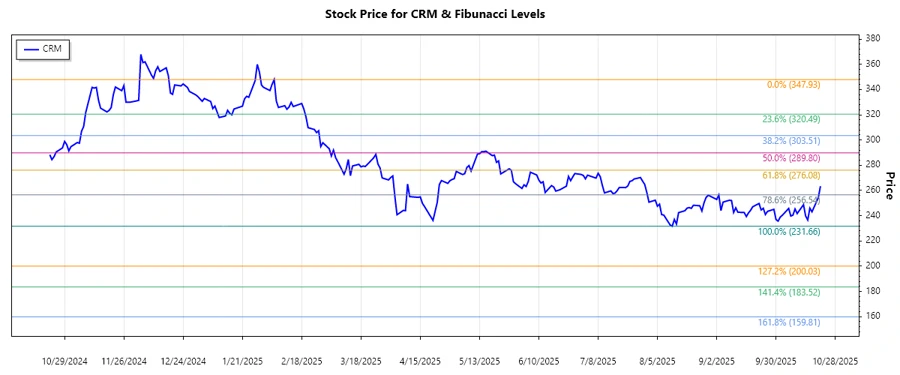
| Trend Start Date | 2025-02-05 |
| Trend End Date | 2025-10-21 |
| High Point | $347.93 (2025-02-05) |
| Low Point | $231.66 (2025-08-12) |
| Fibonacci Level | Price Level |
|---|---|
| 0.236 | $263.16 |
| 0.382 | $279.05 |
| 0.5 | $289.80 |
| 0.618 | $300.54 |
| 0.786 | $316.43 |
The current price is in the 0.236 Fibonacci retracement zone, which might suggest a potential support level if the bullish trend continues. This indicates that the trend might have enough momentum to reclaim higher levels, allowing traders to look for potential buy signals as the stock stabilizes above these levels.
Conclusion
The Salesforce stock has experienced a downward correction from its peak but found potential support at key Fibonacci retracement levels. This technical analysis suggests a psychological and potential buying zone for investors seeking entry points in a high-potential tech growth stock. However, market participants should remain cautious of broader market volatility and potential bearish takeover below significant support levels, emphasizing the importance of continuous monitoring. As Salesforce leverages its platform's strengths, long-term growth prospects remain optimistic amidst technological innovation and market demand.
Smart Data Insight
Master the Perfect Entry & Exit for this Stock
Don't leave your profits to chance. Historically, this stock follows specific seasonal patterns that institutional traders use to maximize returns.
- ✅ Identify the "Golden Buying Window"
- ✅ Avoid high-risk correction cycles
- ✅ Backtested data from the last 20+ years