May 18, 2026 a 04:03 am
CRL: Trend and Support & Resistance Analysis - Charles River Laboratories International, Inc.
The Charles River Laboratories International, Inc. (CRL) has demonstrated varying trends over the recent months. Historically, the stock has shown both strength and vulnerability in different market conditions. The company's position within the drug discovery and development sector presents potential growth opportunities. Nevertheless, investors should be cautious of market volatility and sector-specific challenges.
Trend Analysis
| Date | Closing Price | Trend |
|---|---|---|
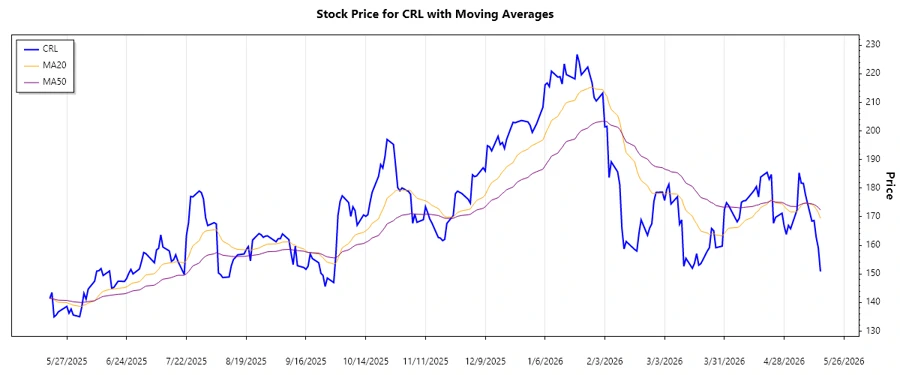
| 2026-05-15 | 150.85 | ▼ |
| 2026-05-14 | 159.12 | ▲ |
| 2026-05-13 | 162.85 | ▲ |
| 2026-05-12 | 168.69 | ▲ |
| 2026-05-11 | 168.46 | ⚖️ |
| 2026-05-08 | 177.62 | ▲ |
| 2026-05-07 | 181.68 | ▲ |
The current technical analysis indicates an overall ▼ downward trend, with the short-term EMA20 falling below the long-term EMA50. This suggests a bearish sentiment in the market for CRL. However, temporary corrections and bullish phases may still appear.
Support- and Resistance
| Zone Type | From | To |
|---|---|---|
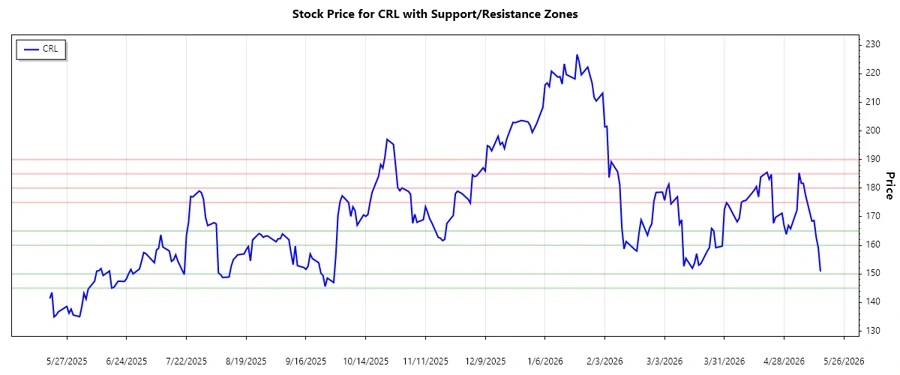
| Support Zone 1 | 145.00 | 150.00 |
| Support Zone 2 | 160.00 | 165.00 |
| Resistance Zone 1 | 175.00 | 180.00 |
| Resistance Zone 2 | 185.00 | 190.00 |
The stock is currently approaching the lower boundary of the second support zone, indicating potential buying interest. A breach below this level may lead to further bearish movement.
Conclusion
Charles River Laboratories International, Inc. presents both opportunities and challenges for investors. The current downward trend suggests caution, though the company's robust position in the pharmaceutical sector offers potential upside. Continued market analysis and sector monitoring are advised for informed investment decisions. Analyst consensus suggests diversification in strategies to mitigate potential risks associated with this stock.
Smart Data Insight
Master the Perfect Entry & Exit for this Stock
Don't leave your profits to chance. Historically, this stock follows specific seasonal patterns that institutional traders use to maximize returns.
- ✅ Identify the "Golden Buying Window"
- ✅ Avoid high-risk correction cycles
- ✅ Backtested data from the last 20+ years