April 14, 2026 a 02:03 pm
CRL: Trend and Support & Resistance Analysis - Charles River Laboratories International, Inc.
Charles River Laboratories International, Inc. operates in a specialized field providing drug discovery and safety testing services. Over recent months, CRL stock has shown significant fluctuations. Understanding the recent historical trend is essential for making informed investment decisions in this highly dynamic sector. This analysis focuses on identifying the trend and crucial support and resistance levels.
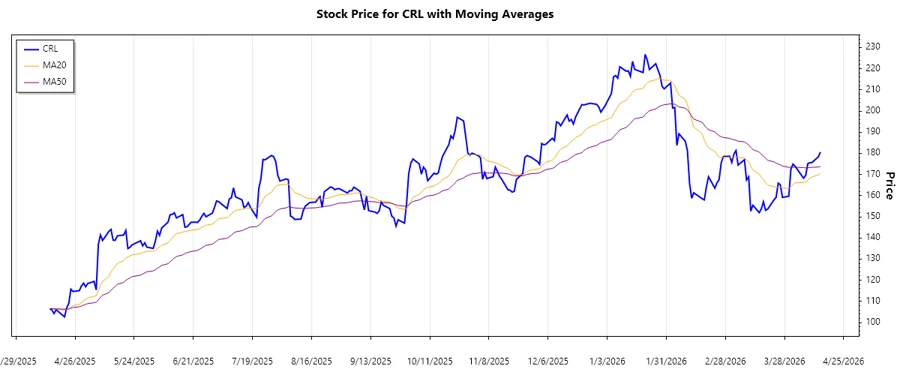
Trend Analysis
Our analysis of the recent historical price data involves the calculation of the 20-day and 50-day EMAs to determine the trend in CRL's stock.
| Date | Close Price | Trend |
|---|---|---|
| April 14, 2026 | $180.60 | ▼ |
| April 13, 2026 | $178.34 | ▼ |
| April 10, 2026 | $175.65 | ▼ |
| April 09, 2026 | $175.55 | ▼ |
| April 08, 2026 | $175.07 | ▼ |
| April 07, 2026 | $169.54 | ▼ |
| April 06, 2026 | $168.22 | ▼ |
With the EMA20 (Exponential Moving Average 20 days) lying below EMA50, the trend indicates a persistent ▼ downtrend. This downtrend suggests potential bearish sentiment among investors.
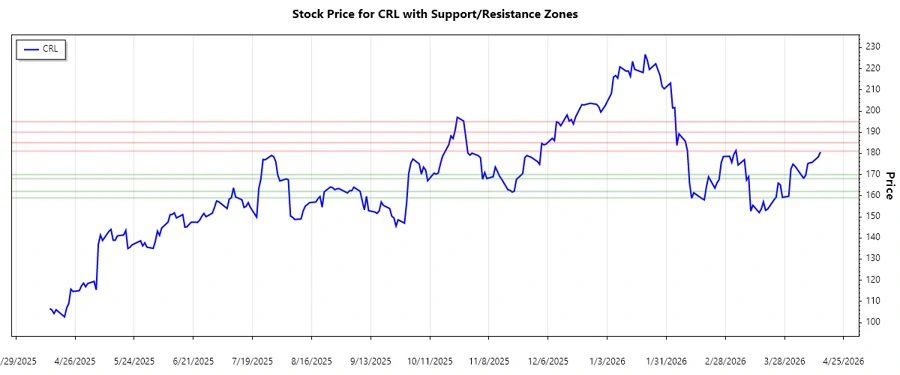
Support- and Resistance
In terms of support and resistance, crucial areas of interest were identified based on historical price behavior:
| Zone Type | Price Range |
|---|---|
| Support | $168.00 - $170.00 |
| Support | $159.00 - $162.00 |
| Resistance | $181.00 - $185.00 |
| Resistance | $190.00 - $195.00 |
Considering the current price positioning, CRL's stock is approaching the upper tier of its support zone around $170. The proximity to this level could provide an accumulation opportunity if buying interest develops.
Conclusion
With a current downward trend, Charles River Laboratories International, Inc.'s stock charts suggest cautious optimism as it tests established support zones. A break below the main support might lead to testing further lower support levels, while a reversal could bring the stock back to resistance levels. Investors should stay vigilant, considering both potential risks from a continued downtrend and opportunities for a reversal at critical support levels.