
June 19, 2026 a 11:44 am
CRL: Fibonacci Analysis - Charles River Laboratories International, Inc.
Charles River Laboratories International, Inc. (CRL) has seen recent market turbulence reflective of broader industry challenges and specific corporate developments. The company continues to capitalize on its core segments, but recent price movements suggest a reassessment of investor sentiment. CRL's commitment to innovation in drug discovery and manufacturing solutions remains a pivotal driver of its business model.
Fibonacci Analysis
| Information | Details |
|---|---|
| Trend Start Date | 2026-05-18 |
| Trend End Date | 2026-06-18 |
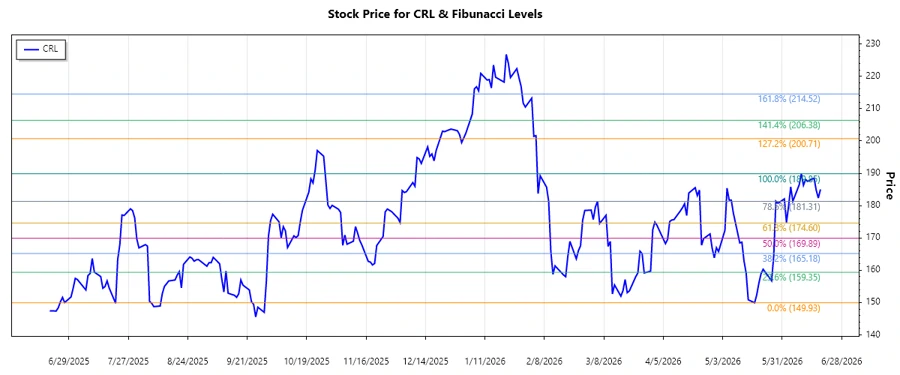
| High Price | $189.85 on 2026-06-09 |
| Low Price | $149.93 on 2026-05-18 |
| Fibonacci Levels |
|
| Current Price in Retracement | 0.786 |
| Technical Interpretation | The current price action is testing the 0.786 retracement level, indicating a potential resistance zone. If this level holds, we could see a reversal or consolidation. |
Conclusion
The analysis of Charles River Laboratories International, Inc. indicates a significant upward trend from mid-May to mid-June 2026. The stock recently achieved a high point but is currently testing the 0.786 Fibonacci retracement level. This suggests potential resistance, which could lead to either a reversal or a consolidation phase. Analysts should monitor the stock's behavior around this level for further indications of strength or weakness in the trend. The company's robust business segments provide a solid foundation for growth, but market volatility and the ability to maintain support levels will crucially impact future performance.
Smart Data Insight
Master the Perfect Entry & Exit for this Stock
Don't leave your profits to chance. Historically, this stock follows specific seasonal patterns that institutional traders use to maximize returns.
- ✅ Identify the "Golden Buying Window"
- ✅ Avoid high-risk correction cycles
- ✅ Backtested data from the last 20+ years