October 03, 2025 a 10:15 am
CRL: Fibonacci Analysis - Charles River Laboratories International, Inc.
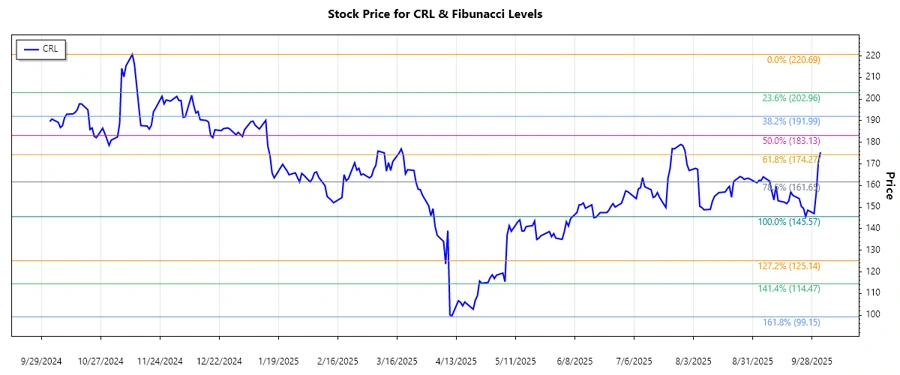
Charles River Laboratories International, Inc. (CRL) has shown significant movements over the past months, with a considerable downward trend recently dominating its stock price fluctuation. As a company providing critical drug discovery and safety testing services worldwide, its stock is influenced by various market conditions and pharmaceutical demands. The recent data suggest some recovery potential, albeit with caution due to possible market variabilities.
Fibonacci Analysis
| Trend Analysis | Details |
|---|---|
| Trend Type | Downtrend |
| Start Date | 2024-11-11 |
| End Date | 2025-09-29 |
| High Price & Date | $220.69 on 2024-11-11 |
| Low Price & Date | $145.57 on 2025-09-25 |
| Fibonacci Level | Price Level |
|---|---|
| 0.236 | 161.66 |
| 0.382 | 173.27 |
| 0.5 | 183.13 |
| 0.618 | 192.99 |
| 0.786 | 205.87 |
The current price is positioned outside of the significant Fibonacci retracement zones, hovering slightly above the 0.382 retracement level. This suggests that the stock is exhibiting resistance at the upper retracement levels, indicating potential stabilization or further decline unless bullish momentum increases.
Conclusion
The stock of Charles River Laboratories International, Inc. is currently under a downward market pressure. A presence near the lower Fibonacci retracement levels indicates potential support zones for a recovery; however, caution is required. The recent stabilizing movements magnify the significance of these levels. For investors, the uncertainty of breaking upper resistance levels forms a precautionary barrier. Should the stock price rise beyond the 0.618 level, a potential bullish signal may emerge. Conversely, declining below the 0.382 level could suggest prolonged bearish trends.
Smart Data Insight
Master the Perfect Entry & Exit for this Stock
Don't leave your profits to chance. Historically, this stock follows specific seasonal patterns that institutional traders use to maximize returns.
- ✅ Identify the "Golden Buying Window"
- ✅ Avoid high-risk correction cycles
- ✅ Backtested data from the last 20+ years