
June 15, 2025 a 05:15 am
CRL: Fibonacci Analysis - Charles River Laboratories International, Inc.
Charles River Laboratories International, Inc. has shown a dynamic trajectory over the last few months. As a key player in the non-clinical contract research organization sector, the company's stock has experienced significant volatility. Based on recent price movements, the stock is currently displaying a dominant downtrend pattern. Investors should pay close attention to technical signals, particularly Fibonacci retracement levels, for potential entry and exit points.
Fibonacci Analysis
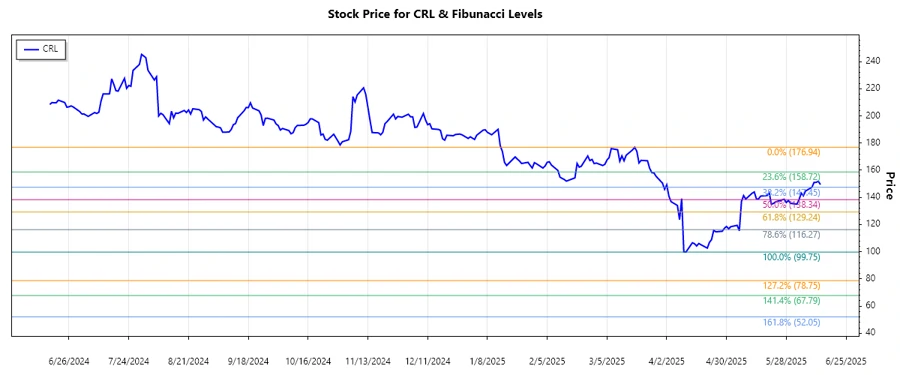
The analysis identifies a dominant downtrend in Charles River Laboratories International, Inc. (Ticker: CRL) from February 2025 to June 2025.
| Start Date | End Date | High Price (Date) | Low Price (Date) |
|---|---|---|---|
| 2025-02-13 | 2025-06-13 | 176.94 (2025-03-18) | 99.75 (2025-04-11) |
| Fibonacci Level | Price |
|---|---|
| 0.236 | 117.62 |
| 0.382 | 128.83 |
| 0.5 | 138.35 |
| 0.618 | 147.87 |
| 0.786 | 160.12 |
As of the latest data, the current price of $149.45 places the stock within the 0.618 Fibonacci retracement zone, indicating that the stock is potentially facing resistance at this level.
Technically, this could suggest that if the price breaks above this level, it could seek the next resistance around 0.786. Conversely, failing to breach might lead to another testing of lower supports.
Conclusion
Charles River Laboratories International, Inc.'s stock is currently experiencing a corrective pattern after a significant downtrend. The presence at the 0.618 Fibonacci level suggests a critical juncture that could determine the next price trajectory. Investors should remain cautious, as a failure to break resistance could mean a continuation of the bearish trend. However, a successful breakout might signal a turning point, providing potential short-term opportunities. Fundamentally, while the company's research services continue to be in demand, market volatility and sector-specific challenges might present risks that must be reviewed continuously.
Smart Data Insight
Master the Perfect Entry & Exit for this Stock
Don't leave your profits to chance. Historically, this stock follows specific seasonal patterns that institutional traders use to maximize returns.
- ✅ Identify the "Golden Buying Window"
- ✅ Avoid high-risk correction cycles
- ✅ Backtested data from the last 20+ years