
July 07, 2026 a 03:15 pm

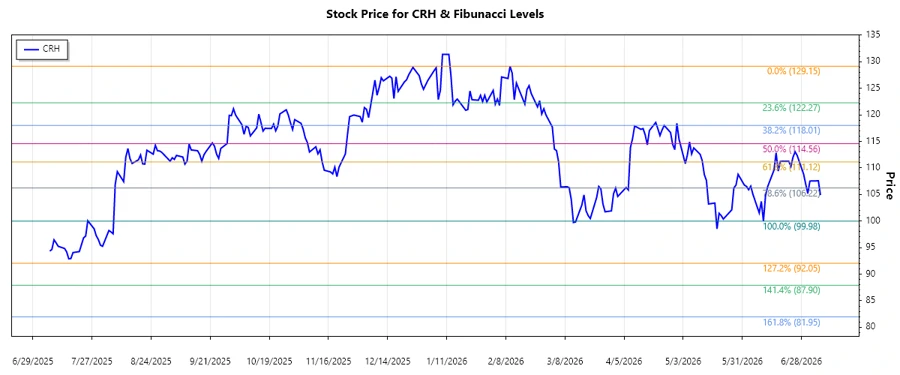
CRH: Fibonacci Analysis - CRH plc
CRH plc has been a significant player in the building materials sector with extensive operations across multiple continents. The stock has experienced fluctuations reflective of broader market trends and its own operational efficiencies. Most recently, a trend analysis shows significant changes within the stock's price movements, providing opportunities for technical analysis and future forecasting.
Fibonacci Analysis
The analysis of the recent trend data for CRH reveals a dominant downward trend from early 2026. The price reached a high of $129.15 on February 10, 2026, and declined to a low of $99.98 on June 10, 2026. Fibonacci levels were calculated to analyze potential retracement levels for future resistance or support.
| Parameter | Details |
|---|---|
| Start Date | 2026-02-10 |
| End Date | 2026-06-10 |
| High Price (Date) | $129.15 (2026-02-10) |
| Low Price (Date) | $99.98 (2026-06-10) |
| Fibonacci 0.236 | $107.72 |
| Fibonacci 0.382 | $112.58 |
| Fibonacci 0.5 | $114.57 |
| Fibonacci 0.618 | $116.56 |
| Fibonacci 0.786 | $120.45 |
| Current Price | $104.88 (as of 2026-07-07) |
| Retracement Zone | None |
The current price of $104.88 does not fall within any major retracement zone, suggesting the need to monitor for any move towards these levels for a potential reversal or continuation of the trend.
The analysis indicates that if the stock retraces to any of these Fibonacci levels, they could act as potential resistance, alternating depending on market conditions and investor sentiment. Trading volumes should be monitored for confirmation.
Conclusion
The CRH plc stock has been on a dominant downward trend since its high in February 2026. Currently, trading below key Fibonacci retracement levels, it suggests potential further downside unless resistance at these levels is tested and held. Investors should be cautious and watch for potential price reactions at Fibonacci retracement levels which may indicate trend reversals. The fundamental backdrop of CRH's market position is strong, but technical indicators suggest a more cautious approach is needed in the near term. Opportunities may arise if the stock finds fundamental support or broader market conditions improve.
Smart Data Insight
Master the Perfect Entry & Exit for this Stock
Don't leave your profits to chance. Historically, this stock follows specific seasonal patterns that institutional traders use to maximize returns.
- ✅ Identify the "Golden Buying Window"
- ✅ Avoid high-risk correction cycles
- ✅ Backtested data from the last 20+ years