June 16, 2026 a 12:46 pm

CRH: Dividend Analysis - CRH plc
CRH plc, a prominent player in the construction materials industry, stands out with a strong dividend history, highlighted by a consistent payout over the past 38 years. The company demonstrates moderate growth potential, accentuated by a current dividend yield of approximately 1.47%. With no recent dividend cuts or suspensions, CRH offers a stable income opportunity, reflective of its robust market presence and operational resilience. Investors should nonetheless consider the historical growth patterns, which show slowed increments, when forecasting future dividend performances.
Overview 📊
CRH operates within the construction materials sector, exhibiting a dividend yield of 1.47% with a current dividend per share standing at 1.48 USD. The company has sustained its dividend payments for 38 years without any recent cuts or suspensions. This track record solidifies its reputation as a reliable income generator for investors seeking stability in their investment portfolios.
| Metric | Value |
|---|---|
| Sector | Construction Materials |
| Dividend yield | 1.47% |
| Current dividend per share | 1.48 USD |
| Dividend history | 38 years |
| Last cut or suspension | None |
Dividend History 🗣️
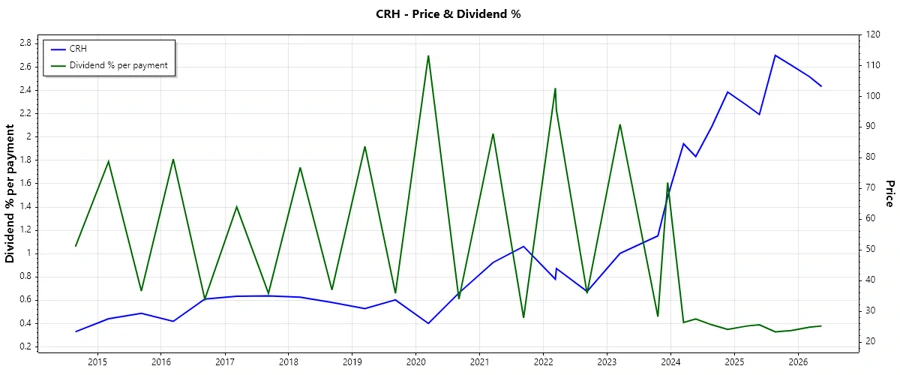
The historic dividend payouts are indicative of CRH's commitment to returning value to shareholders. The consistency in dividend history underscores the financial health and strategic foresight of the company. Such a robust history also incentivizes long-term investment, offering reassurance to stakeholders about the sustainability of returns.
| Year | Dividend per Share (USD) |
|---|---|
| 2026 | 0.78 |
| 2025 | 1.48 |
| 2024 | 1.40 |
| 2023 | 2.36 |
| 2022 | 2.20 |
Dividend Growth 📈
Understanding the growth trajectory of dividends is crucial as it reflects the company's profitability and long-term prospects. In recent years, CRH has experienced a minimal decline of -0.12% over three years and a marginal growth of 0.10% over five years. While the average growth rate over 5 years is modest, it reflects a steady increase, highlighting controlled, stable growth amidst market fluctuations.
| Time | Growth |
|---|---|
| 3 years | -0.12% |
| 5 years | 0.10% |
The average dividend growth is 0.10% over 5 years. This shows moderate but steady dividend growth.
Payout Ratio ⚠️
Payout ratios help measure the sustainability of dividend payments. CRH's EPS-based payout ratio is nearly 19.57%, while the FCF-based payout ratio is approximately 34.35%. A lower EPS ratio indicates room to reinvest in the business, yet the figures also signal a strategic approach towards balancing shareholder returns with growth initiatives.
| Key figure | Ratio |
|---|---|
| EPS-based | 19.57% |
| Free cash flow-based | 34.35% |
The ratios suggest CRH's dividends are well-covered, with ample capacity to adjust payouts without jeopardizing financial stability.
Cashflow & Capital Efficiency 📊
Cash flows and capital efficiency are critical for assessing a company's ability to sustain its dividend yields without compromising growth. Reviewing recent years, the Free Cash Flow Yield is robust, complementing a moderate Earnings Yield. Investor confidence is bolstered by an efficient allocation of capital expenditures relative to operating cash flow.
| Year | 2025 | 2024 | 2023 |
|---|---|---|---|
| Free Cash Flow Yield | 3.47% | 3.75% | 5.89% |
| Earnings Yield | 4.44% | 5.47% | 6.30% |
| CAPEX to Operating Cash Flow | 48% | 51% | 36% |
| Stock-based Compensation to Revenue | 0.38% | 0.36% | 0.35% |
| Free Cash Flow / Operating Cash Flow Ratio | 51% | 49% | 64% |
The analysis suggests a strong cash flow framework capable of supporting dividends while reinvesting in growth initiatives.
Balance Sheet & Leverage Analysis 📊
A lean balance sheet with efficient leverage supports dividend reliability. CRH maintains controlled debt levels, reflected in a Debt-to-Equity ratio under 1 and a satisfactory interest coverage ratio, indicating strong financial health and liquidity.
| Year | 2025 | 2024 | 2023 |
|---|---|---|---|
| Debt-to-Equity | 0.82 | 0.71 | 0.62 |
| Debt-to-Assets | 0.34 | 0.30 | 0.27 |
| Debt-to-Capital | 0.45 | 0.41 | 0.38 |
| Net Debt to EBITDA | 2.09 | 1.63 | 1.11 |
| Current Ratio | 1.74 | 1.37 | 1.69 |
| Quick Ratio | 1.14 | 0.91 | 1.26 |
| Financial Leverage | 2.43 | 2.34 | 2.28 |
The financial posture supports consistent dividend payments, enhancing investor confidence in the company's future prospects.
Fundamental Strength & Profitability 🏦
The core profitability metrics such as Return on Equity and Assets reflect CRH's ability to generate income against its equity and assets base. The thick margins in net, EBIT, EBITDA, and gross profit ensure that the company retains solid valuation fundamentals, emphasizing its efficiency in converting sales into actual earnings.
| Year | 2025 | 2024 | 2023 |
|---|---|---|---|
| Return on Equity | 15.54% | 16.57% | 16.64% |
| Return on Assets | 6.39% | 7.07% | 7.31% |
| Net Margin | 9.96% | 10.07% | 9.93% |
| EBIT Margin | 14.21% | 14.97% | 12.56% |
| EBITDA Margin | 19.97% | 20.03% | 17.23% |
| Gross Margin | 36.13% | 35.71% | 34.23% |
| Research & Development to Revenue | 0% | 0% | 0% |
CRH showcases strong profitability metrics, indicating robust financial health and the ability to sustain its dividends through various market cycles.
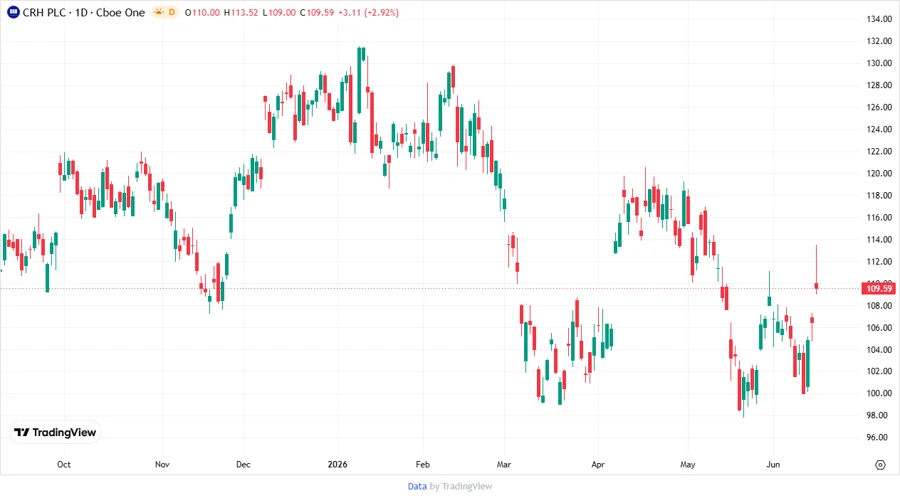
Price Development 📉
Dividend Scoring System ✅
| Criterion | Score | Bar |
|---|---|---|
| Dividend yield | 3 | |
| Dividend Stability | 5 | |
| Dividend growth | 2 | |
| Payout ratio | 4 | |
| Financial stability | 4 | |
| Dividend continuity | 5 | |
| Cashflow Coverage | 4 | |
| Balance Sheet Quality | 5 |
Total Score: 32/40
Rating 🌟
CRH secures a solid rating, demonstrating robust dividend policies underscored by a continuous payout track record and strong financial positioning. Its moderate growth rates are a watch-point for growth-focused investors, yet its stable yield and historical reliability make it an attractive choice for income-seeking portfolios. Overall, CRH receives a recommendation to hold as part of a diversified investment strategy.
Smart Data Insight
Master the Perfect Entry & Exit for this Stock
Don't leave your profits to chance. Historically, this stock follows specific seasonal patterns that institutional traders use to maximize returns.
- ✅ Identify the "Golden Buying Window"
- ✅ Avoid high-risk correction cycles
- ✅ Backtested data from the last 20+ years