
July 04, 2026 a 04:44 pm
CPT: Fibonacci Analysis - Camden Property Trust
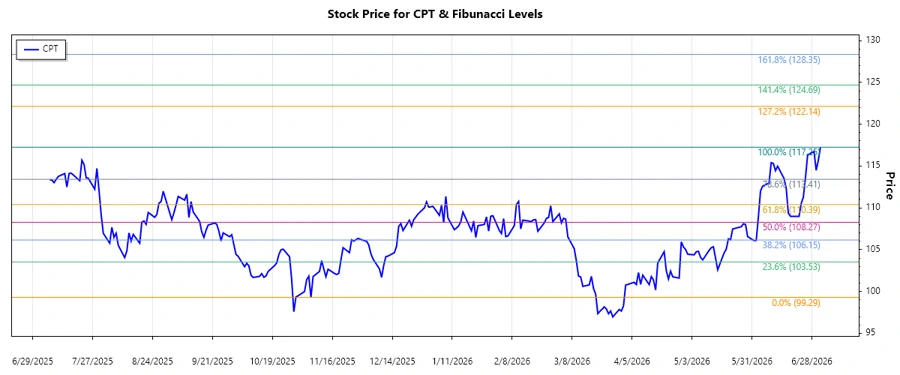
Camden Property Trust has shown notable performance, underlined by an upward trend visible from recent stock price movements. The company, which manages a vast portfolio of multi-family residential complexes, has not only expanded its operational capabilities but also gained recognition for its exemplary workplace culture. These accomplishments position Camden well in the market, suggesting strong investor confidence.
Fibonacci Analysis
| Parameter | Details |
|---|---|
| Start Date | 2025-11-06 |
| End Date | 2026-07-02 |
| High Price | $117.25 (2026-07-02) |
| Low Price | $99.29 (2025-11-06) |
| Fibonacci Levels |
|
| Current Price | $117.25 (2026-07-02) |
| Retracement Zone | none |
| Technical Interpretation | The prices surpass the highest Fibonacci level, indicating a possible continuation of the uptrend. |
Conclusion
Camden Property Trust's upward trajectory in its stock price highlights a sustained investor interest and confidence in its business model. While the current price holds above significant Fibonacci retracement levels, indicating a strong uptrend, market volatility always poses inherent risks. For investors, this could signal a good opportunity to capitalize on the strength of Camden’s market presence. Nonetheless, as with any investment, it remains crucial to keep an eye on wider economic factors that might influence the real estate market.
Smart Data Insight
Master the Perfect Entry & Exit for this Stock
Don't leave your profits to chance. Historically, this stock follows specific seasonal patterns that institutional traders use to maximize returns.
- ✅ Identify the "Golden Buying Window"
- ✅ Avoid high-risk correction cycles
- ✅ Backtested data from the last 20+ years