February 21, 2026 a 06:44 am

CPT: Fibonacci Analysis - Camden Property Trust
Camden Property Trust has demonstrated a nuanced trading pattern over recent months. The firm’s strategic positioning in the real estate sector, especially in multifamily apartment communities, offers a robust foundation amidst market fluctuations. Recent trends indicate a subtle shift in price dynamics, deserving a detailed technical evaluation to gauge potential support and resistance levels effectively.
Fibonacci Analysis
| Detail | Value |
|---|---|
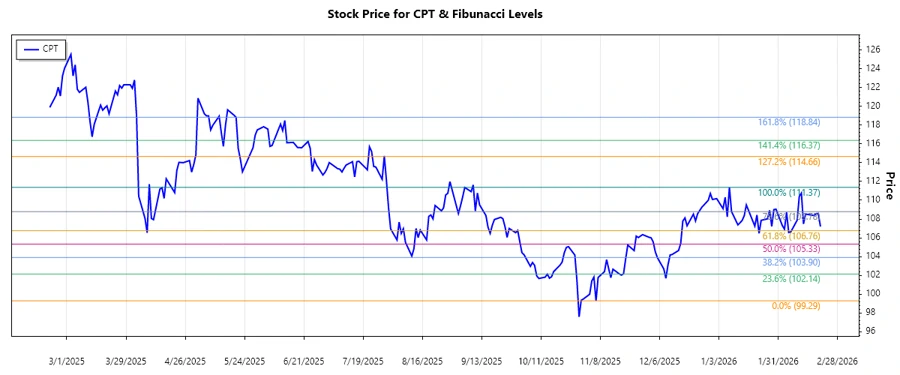
| Trend Start Date | 2025-11-05 |
| Trend End Date | 2026-01-08 |
| High Price and Date | $111.37 on 2026-01-08 |
| Low Price and Date | $99.29 on 2025-11-05 |
| Fibonacci Levels |
|
| Current Price Position | Current price around $107.20 is in the 0.618 retracement zone |
| Technical Interpretation | The 0.618 Fibonacci retracement level acts as a potential support. Continuous oscillation around this level could indicate potential support, suggesting a bullish reversal if confirmed by further analysis. |
An illustrative stock chart showing the recent trend and Fibonacci levels.
Conclusion
Camden Property Trust's stock analysis highlights a prevailing upward trend with potential support around its Fibonacci levels. While the company's strong hold in the real estate sector provides a buffer, technical indicators present opportunities and warnings. The stock’s position at the 0.618 Fibonacci retracement level may suggest a robust support zone, offering a bullish outlook if maintained. However, investors should remain vigilant of market volatility and potential resistance. In summary, Camden presents a balanced but optimistic potential for growth, contingent on maintaining its strategic business posture and market conditions.