
June 18, 2026 a 12:46 pm

CPT: Dividend Analysis - Camden Property Trust
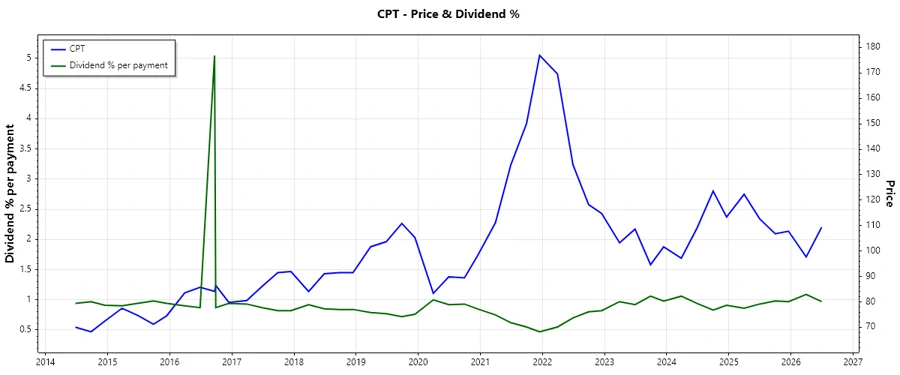
Camden Property Trust, with over 34 years of dividend distribution, solidifies its position as a reliable REIT in the market. Its steady dividend yield of approximately 3.86% indicates both profitability and shareholder value focus. Despite heightened payout ratios, its history of consistency highlights its commitment to its investors.
📊 Overview
The overview provides a snapshot of Camden Property Trust's sector and key dividend metrics, essential for understanding the company's commitment to shareholder returns.
| Criteria | Details |
|---|---|
| Sector | Real Estate |
| Dividend yield | 3.86 % |
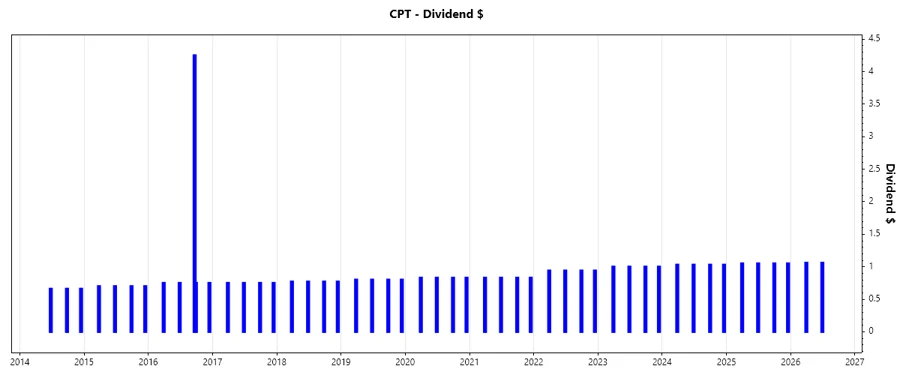
| Current dividend per share | 4.25 USD |
| Dividend history | 34 years |
| Last cut or suspension | None |
🗣️ Dividend History
Tracking dividend history reveals Camden Property Trust's dedication to maintaining and increasing distributions, which reflects management's confidence in future cash flows and corporate governance. This provides investors with insight into cash return consistency.
| Year | Dividend per Share (USD) |
|---|---|
| 2026 | 2.12 |
| 2025 | 4.20 |
| 2024 | 4.12 |
| 2023 | 4.00 |
| 2022 | 3.76 |
🔍 Dividend Growth
An analysis of dividend growth is crucial in evaluating the company's potential to increase shareholder remuneration. Camden Property Trust shows modest but reliable growth, indicative of sustainable financial health.
| Time | Growth |
|---|---|
| 3 years | 3.76% |
| 5 years | 4.81% |
The average dividend growth is 4.81% over 5 years. This shows moderate but steady dividend growth.
✅ Payout Ratio
Payout ratios indicate the proportion of earnings distributed as dividends. Camden Property Trust's EPS-based payout ratio of 114.88% suggests a relatively high dividend obligation compared to its earnings, highlighting potential liquidity or sustainability concerns. The FCF-based ratio of 59.88% indicates a more balanced approach from cash flows.
| Key figure ratio | Percentage |
|---|---|
| EPS-based | 114.88% |
| Free cash flow-based | 59.88% |
📈 Cashflow & Capital Efficiency
Understanding cash flow and capital efficiency is vital for gauging a company's ability to sustain dividends and make strategic investments. Certain metrics also provide insight into operational effectiveness and cost management strategies.
| Metric | 2023 | 2024 | 2025 |
|---|---|---|---|
| Free Cash Flow Yield | 3.56% | 3.02% | 3.24% |
| Earnings Yield | 3.74% | 1.30% | 3.22% |
| CAPEX to Operating Cash Flow | 51.69% | 50.81% | 53.27% |
| Stock-based Compensation to Revenue | 0.94% | 0.98% | 1.08% |
| Free Cash Flow / Operating Cash Flow Ratio | 48.31% | 49.19% | 46.72% |
📉 Balance Sheet & Leverage Analysis
A comprehensive examination of balance sheet metrics and leverage ratios reveals Camden Property Trust's financial solidity, debt management capabilities, and liquidity profiles critical for long-term dividend sustainability.
| Metric | 2023 | 2024 | 2025 |
|---|---|---|---|
| Debt-to-Equity | 0.75 | 0.75 | 0.89 |
| Debt-to-Assets | 0.40 | 0.39 | 0.43 |
| Debt-to-Capital | 0.43 | 0.43 | 0.47 |
| Net Debt to EBITDA | 3.58 | 3.91 | 3.38 |
| Current Ratio | 0.65 | 0.10 | 0.10 |
| Quick Ratio | 0.65 | 0.10 | 0.10 |
| Financial Leverage | 1.88 | 1.89 | 2.07 |
📈 Fundamental Strength & Profitability
Fundamental metrics and profitability ratios determine the intrinsic strength of a company. They provide insights into how assets are being utilized to generate revenue and return value to shareholders.
| Metric | 2023 | 2024 | 2025 |
|---|---|---|---|
| Return on Equity | 8.09% | 3.49% | 8.81% |
| Return on Assets | 4.30% | 1.84% | 4.25% |
| Net Margin | 26.15% | 10.58% | 24.43% |
| EBIT Margin | 35.51% | 19.66% | 34.14% |
| EBITDA Margin | 72.79% | 57.36% | 72.96% |
| Gross Margin | 62.11% | 61.18% | 61.41% |
| R&D to Revenue | 0% | 0% | 0% |
📉 Price Development
Dividend Scoring System
| Category | Score | Progress |
|---|---|---|
| Dividend yield | 4 | |
| Dividend Stability | 5 | |
| Dividend growth | 3 | |
| Payout ratio | 2 | |
| Financial stability | 3 | |
| Dividend continuity | 5 | |
| Cashflow Coverage | 3 | |
| Balance Sheet Quality | 3 |
Total Score: 28/40
🔍 Rating
Camden Property Trust demonstrates a commendable track record in dividend stability and market reliability. However, its elevated payout ratios and modest EPS incentives demand cautious optimism. Investors prioritizing consistent returns may find its mature dividend profile attractive, although attention to cash flow dynamics remains paramount.
Smart Data Insight
Master the Perfect Entry & Exit for this Stock
Don't leave your profits to chance. Historically, this stock follows specific seasonal patterns that institutional traders use to maximize returns.
- ✅ Identify the "Golden Buying Window"
- ✅ Avoid high-risk correction cycles
- ✅ Backtested data from the last 20+ years