
May 28, 2026 a 12:46 pm
CPT: Dividend Analysis - Camden Property Trust
Camden Property Trust (CPT) stands out in the sector with a notable dividend history, showcasing stability and consistent growth. Investors seeking reliable income growth might consider CPT, given its impressive dividend yield and history of 34 years without a suspension. However, potential investors should be aware of the high payout ratios and assess the company's ability to sustain such dividends.
📊 Overview
| Aspect | Details |
|---|---|
| Sector | Real Estate Investment Trusts (REITs) |
| Dividend Yield | 4.31 % |
| Current Dividend Per Share | 4.25 USD |
| Dividend History | 34 years |
| Last Cut or Suspension | None |
🗣️ Dividend History
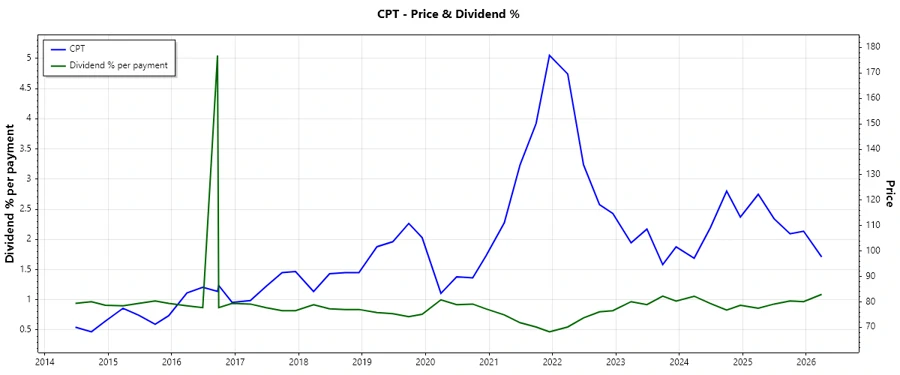
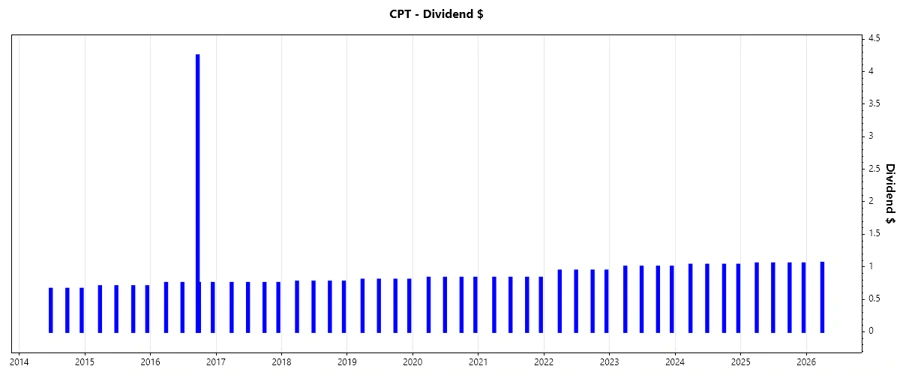
The dividend history of Camden Property Trust is remarkable with consistent increases over the years, reflecting a robust commitment to shareholder returns. This solid track record plays a crucial role in reinforcing investor trust and predicting future performance reliability.
| Year | Dividend per Share (USD) |
|---|---|
| 2026 | 1.06 |
| 2025 | 4.20 |
| 2024 | 4.12 |
| 2023 | 4.00 |
| 2022 | 3.76 |
📈 Dividend Growth
The analysis of dividend growth is a critical indicator of the company's future potential to increase shareholder value. Understanding growth trends over several years helps predict the sustainability and expansion potential of dividends.
| Time | Growth |
|---|---|
| 3 years | 3.76 % |
| 5 years | 4.81 % |
The average dividend growth is 4.81% over 5 years. This shows moderate but steady dividend growth, reflecting the company's ongoing efforts to enhance shareholder value through increased payouts.
Payout Ratio (H2)
The payout ratio is a measure of a company's ability to sustain its dividend payments out of its earnings. Examining both EPS-based and FCF-based ratios provides insights into the dividend's sustainability given the company's cash flow.
| Key Figure | Ratio |
|---|---|
| EPS-based | 114.88 % |
| Free cash flow-based | 59.88 % |
The EPS-based payout ratio of 114.88% indicates that the dividend payments exceed the earnings, which may pose sustainability concerns. However, the FCF-based ratio of 59.88% suggests stronger support for the dividend from cash flow operations.
Cashflow & Capital Efficiency
Understanding cash flow stability and capital efficiency is essential for evaluating how well the company generates cash from its operations and its ability to fund its capital needs efficiently without external financing.
| Metric | 2023 | 2024 | 2025 |
|---|---|---|---|
| Free Cash Flow Yield | 3.56% | 3.03% | 3.24% |
| Earnings Yield | 3.74% | 1.30% | 3.22% |
| CAPEX to Operating Cash Flow | 51.69% | 50.81% | 53.28% |
| Stock-based Compensation to Revenue | 0.94% | 0.98% | 1.08% |
| Free Cash Flow / Operating Cash Flow Ratio | 48.31% | 49.19% | 46.72% |
The stability of cash flow and capital efficiency ratios point towards a solid internal capability for generating cash, although the CAPEX levels are relatively high, which may affect long-term cash availability.
Balance Sheet & Leverage Analysis
An essential component of financial analysis is the balance sheet, which provides insights into a company's leverage and liquidity position, affecting its overall financial stability.
| Metric | 2023 | 2024 | 2025 |
|---|---|---|---|
| Debt-to-Equity | 0.75 | 0.75 | 0.89 |
| Debt-to-Assets | 0.40 | 0.39 | 0.43 |
| Debt-to-Capital | 0.43 | 0.43 | 0.47 |
| Net Debt to EBITDA | 3.08 | 3.91 | 3.38 |
| Current Ratio | 0.65 | 0.10 | 0.10 |
| Quick Ratio | 0.65 | 0.10 | 0.10 |
| Financial Leverage | 1.88 | 1.89 | 2.07 |
The leverage ratios indicate moderate use of debt financing, but lower liquidity ratios might present liquidity risk, necessitating careful cash flow management to meet short-term obligations.
Fundamental Strength & Profitability
Key profitability ratios such as RoE, RoA, and margins reflect the company's ability to generate earnings relative to equity, assets, and revenue, which are pivotal for assessing fundamental strength.
| Metric | 2023 | 2024 | 2025 |
|---|---|---|---|
| Return on Equity | 8.10% | 3.49% | 8.81% |
| Return on Assets | 4.30% | 1.84% | 4.25% |
| Net Profit Margin | 26.15% | 10.58% | 24.43% |
| EBIT Margin | 35.51% | 19.66% | 34.14% |
| EBITDA Margin | 72.79% | 57.36% | 72.97% |
| Gross Margin | 62.11% | 61.18% | 61.41% |
| R&D to Revenue | 0.00% | 0.00% | 0.00% |
Camden's profitability ratios remain robust, showcasing efficient management and competitive positioning. However, the low R&D spending suggests limited investment in innovation.
📉 Price Development
✅ Dividend Scoring System
| Category | Score | Bar |
|---|---|---|
| Dividend Yield | 4 | |
| Dividend Stability | 5 | |
| Dividend Growth | 3 | |
| Payout Ratio | 2 | |
| Financial Stability | 3 | |
| Dividend Continuity | 5 | |
| Cashflow Coverage | 3 | |
| Balance Sheet Quality | 3 |
Overall Score: 28/40
⚠️ Rating
In summary, Camden Property Trust provides an attractive proposition for dividend-focused investors with its solid historical dividend payments and growth track. However, the high EPS payout ratio and liquidity concerns call for cautious optimism. Long-term investors should consider the company's strategy to mitigate these risks while leveraging its strengths in the REIT sector.
Smart Data Insight
Master the Perfect Entry & Exit for this Stock
Don't leave your profits to chance. Historically, this stock follows specific seasonal patterns that institutional traders use to maximize returns.
- ✅ Identify the "Golden Buying Window"
- ✅ Avoid high-risk correction cycles
- ✅ Backtested data from the last 20+ years