
May 25, 2026 a 07:31 am

CPT: Dividend Analysis - Camden Property Trust
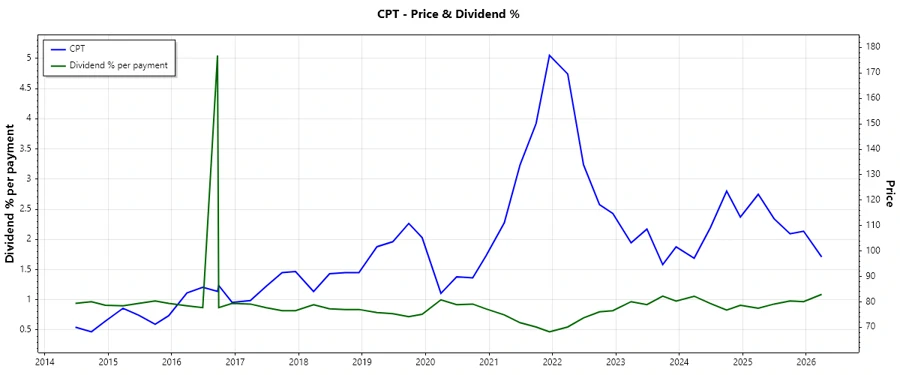
Camden Property Trust displays an impressive dividend history, showcasing consistent and reliable dividends for over three decades. With a notable dividend yield and steady growth, investors might find this stock appealing despite some elevated payout ratios. The company's balance sheet indicates stable leverage levels, although payout ratio metrics might need closer scrutiny.
📊 Overview
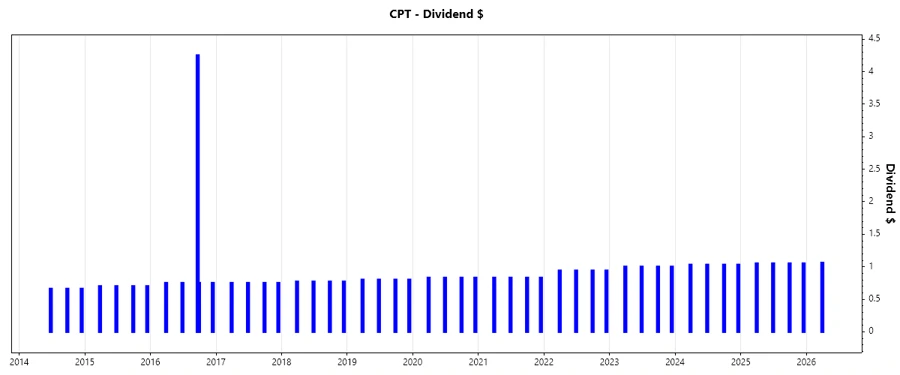
Camden Property Trust, a prominent player in its sector, offers a richly detailed financial profile. A glance at its dividend indicators reveals a noteworthy yield of 4.31%, accompanied by a current dividend of 4.25 USD per share. The company boasts an impressive 34 years of continuous dividend history, showcasing reliability and investor confidence. The absence of recent cuts or suspensions further enhances this sentiment.
| Metric | Value |
|---|---|
| Sector | Real Estate |
| Dividend yield | 4.31 % |
| Current dividend per share | 4.25 USD |
| Dividend history | 34 years |
| Last cut or suspension | None |
🗣️ Dividend History
The dividend history is a cornerstone for understanding investor reliability. Camden Property Trust has maintained dividends for 34 years, an indication of robust financial health and commitment. Analyzing past dividend trends helps predict future payouts and assess the company's sustained ability to distribute profits back to shareholders.
| Year | Dividend Per Share (USD) |
|---|---|
| 2026 | 1.06 |
| 2025 | 4.20 |
| 2024 | 4.12 |
| 2023 | 4.00 |
| 2022 | 3.76 |
📈 Dividend Growth
Dividend growth reflects the company's ability to augment shareholder payouts over time, a critical factor for income investors focused on long-term value creation. Camden Property Trust's growth rate over three and five years, though moderate, suggests a steadiness in their operational model.
| Time | Growth |
|---|---|
| 3 years | 3.76 % |
| 5 years | 4.81 % |
The average dividend growth is 4.81 % over 5 years. This shows moderate but steady dividend growth.
🌟 Payout Ratio
Understanding payout ratios is essential in determining dividend sustainability. Camden's EPS-based payout ratio at 114.88% raises a cautionary flag regarding coverage, suggesting payout exceeds earnings. Conversely, the FCF-based ratio at 59.88% indicates a more sustainable leverage from cash flows.
| Key Figure | Ratio |
|---|---|
| EPS-based | 114.88 % |
| Free cash flow-based | 59.88 % |
💸 Cashflow & Capital Efficiency
The company's cashflow metrics indicate its efficiency and capital management ability. Evaluating ratios like FCF yield and CAPEX/Opex reveals operational discipline. With a high Free Cash Flow yield of 6.61% and strategic CAPEX allocations, Camden shows a balanced approach in funding growth while maintaining liquidity.
| Year | 2025 | 2024 | 2023 |
|---|---|---|---|
| Free Cash Flow Yield | 3.24% | 3.03% | 3.56% |
| Earnings Yield | 3.22% | 1.30% | 3.74% |
| CAPEX to Operating Cash Flow | 53.28% | 50.81% | 51.69% |
| Stock-based Compensation to Revenue | 1.08% | 0.98% | 0.94% |
| Free Cash Flow / Operating Cash Flow Ratio | 46.72% | 49.19% | 48.31% |
| Return on Invested Capital | 3.33% | 3.46% | 3.58% |
🔍 Balance Sheet & Leverage Analysis
A bullish leverage profile mitigates risks for Camden, offering financial stability backed by sound debt ratios. The Debt-to-Equity ratio near 89% mirrors industry norms, and a Current Ratio under 1 might signal liquidity management focus.
| Year | 2025 | 2024 | 2023 |
|---|---|---|---|
| Debt-to-Equity | 89.42% | 74.55% | 74.59% |
| Debt-to-Assets | 43.14% | 39.38% | 39.59% |
| Debt-to-Capital | 47.21% | 42.71% | 42.72% |
| Net Debt to EBITDA | 3.58X | 3.91X | 3.08X |
| Current Ratio | 0.11 | 0.10 | 0.65 |
| Quick Ratio | 0.10 | 0.10 | 0.65 |
| Financial Leverage | 2.073X | 1.893X | 1.884X |
📉 Fundamental Strength & Profitability
Camden's profitability margins showcase efficiency in converting revenues into actual profits. Strong net margins averaged across years indicate potential for reinvestment and leveraging R&D, albeit low, for future growth. The ROE has seen stable increments, adhering to shareholder interests.
| Year | 2025 | 2024 | 2023 |
|---|---|---|---|
| Return on Equity | 8.81% | 3.49% | 8.10% |
| Return on Assets | 4.25% | 1.84% | 4.30% |
| Net Margin | 24.43% | 10.58% | 26.15% |
| EBIT Margin | 34.14% | 19.66% | 35.51% |
| EBITDA Margin | 72.97% | 57.36% | 72.79% |
| Gross Margin | 61.41% | 61.18% | 62.11% |
| R&D to Revenue | 0% | 0% | 0% |
📊 Price Development
🌟 Dividend Scoring System
| Criteria | Score | |
|---|---|---|
| Dividend yield | 4 | |
| Dividend Stability | 5 | |
| Dividend growth | 3 | |
| Payout ratio | 2 | |
| Financial stability | 4 | |
| Dividend continuity | 5 | |
| Cashflow Coverage | 3 | |
| Balance Sheet Quality | 4 |
Total Score: 30/40
✅ Rating
Camden Property Trust presents a solid dividend profile, with attractive yields and a longstanding history of disbursements. Despite high payout ratios from EPS, the stabilization through cashflow perspectives provides a balanced view. The company is fit for yield-focused investors seeking reliable income, with minor risks in earnings coverage that warrant oversight.
Smart Data Insight
Master the Perfect Entry & Exit for this Stock
Don't leave your profits to chance. Historically, this stock follows specific seasonal patterns that institutional traders use to maximize returns.
- ✅ Identify the "Golden Buying Window"
- ✅ Avoid high-risk correction cycles
- ✅ Backtested data from the last 20+ years