January 24, 2026 a 07:46 am
CPT: Dividend Analysis - Camden Property Trust
Camden Property Trust exhibits a robust dividend profile with a substantial history of 33 years without significant disruptions since 2017. Despite facing some challenges, the company's consistent dividend payouts and yield make it an attractive choice for income-focused investors. However, the elevated payout ratio based on earnings could pose risks if financial conditions worsen.
📊 Overview
The following table provides an overview of Camden Property Trust's dividend-related metrics in the Real Estate sector. The company's steady 3.9% yield and long history of uninterrupted payouts reflect its stability.
| Metric | Details |
|---|---|
| Sector | Real Estate |
| Dividend yield | 3.90% |
| Current dividend per share | $4.16 USD |
| Dividend history | 33 years |
| Last cut or suspension | 2017 |
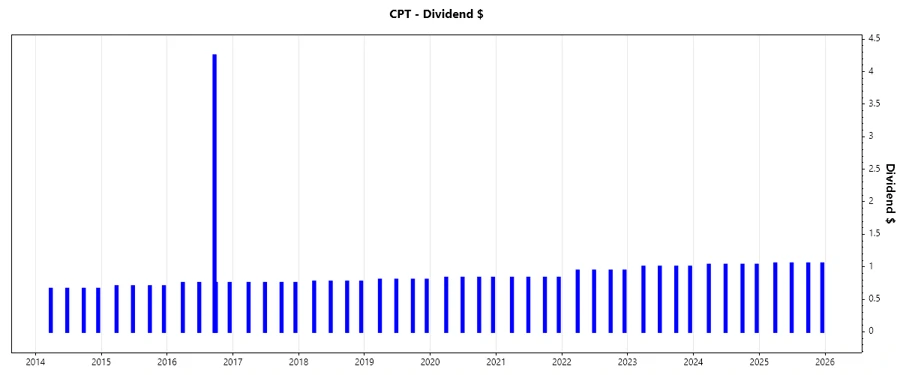
🗣️ Dividend History
Camden Property Trust has maintained a consistent dividend history, reflecting its commitment to returning value to shareholders. The longevity of dividend payments showcases fiscal resilience and can serve as a significant indicator of future performance.
| Year | Dividend per Share (USD) |
|---|---|
| 2025 | 4.20 |
| 2024 | 4.12 |
| 2023 | 4.00 |
| 2022 | 3.76 |
| 2021 | 3.32 |
📈 Dividend Growth
Dividend growth is a critical factor in evaluating a company's ability to increase shareholder wealth. Camden Property Trust's growth rates signal moderate but assured improvement, reflecting a stable business environment and strategic capital allocations.
| Time | Growth |
|---|---|
| 3 years | 3.76% |
| 5 years | 4.81% |
The average dividend growth is 4.81% over 5 years. This shows moderate but steady dividend growth.
⚖️ Payout Ratio
The payout ratio is a vital metric as it indicates how much of its earnings Camden Property Trust pays out as dividends. A higher EPS-based payout ratio suggests potential sustainability challenges, whereas the FCF-based ratio remains at a safer level.
| Key figure | Ratio (%) |
|---|---|
| EPS-based | 167.62% |
| Free cash flow-based | 63.63% |
The EPS-based payout ratio of 167.62% appears high, indicating that the company distributes more than its earnings as dividends, which may not be sustainable. The FCF-based ratio of 63.63% is more manageable and reflects operational cash flows supporting dividend payments.
💵 Cashflow & Capital Efficiency
Cash flow analysis offers insights into Camden's ability to generate cash and its capital expenditure strategy effectiveness. Stability in cash flow and efficient capital use can translate into robust dividend sustainability.
| Year | 2024 | 2023 | 2022 |
|---|---|---|---|
| Free Cash Flow Yield | 3.03% | 3.56% | 2.45% |
| Earnings Yield | 1.30% | 3.74% | 5.43% |
| CAPEX to Operating Cash Flow | 50.81% | 51.69% | 60.35% |
| Stock-based Compensation to Revenue | 0.98% | 0.94% | 0.90% |
| Free Cash Flow / Operating Cash Flow Ratio | 49.19% | 48.31% | 39.65% |
Camden's cash flow stability and efficient capital return promise robust dividend payments, although elevated CAPEX indicates reinvestment priorities.
🧾 Balance Sheet & Leverage Analysis
Leverage and balance sheet metrics are important indicators of Camden's financial health and risk profile. A prudent balance sheet with controlled leverage ensures liquidity and operational flexibility.
| Year | 2024 | 2023 | 2022 |
|---|---|---|---|
| Debt-to-Equity | 74.55% | 74.60% | 73.82% |
| Debt-to-Assets | 39.38% | 39.59% | 39.46% |
| Debt-to-Capital | 42.71% | 42.72% | 42.47% |
| Net Debt to EBITDA | 3.91 | 3.08 | 4.37 |
| Current Ratio | 10.12% | 65.17% | 6.81% |
| Quick Ratio | 10.11% | 65.17% | 6.81% |
| Financial Leverage | 1.89 | 1.88 | 1.87 |
Camden Property Trust maintains a balanced leverage profile with manageable debt levels, indicating solid financial footing and operational resilience against downturns.
💼 Fundamental Strength & Profitability
Fundamental metrics assess Camden's operational efficiency and profitability. These indicators collectively depict the management's capability in maintaining robust profit margins and returns.
| Year | 2024 | 2023 | 2022 |
|---|---|---|---|
| Return on Equity | 3.49% | 8.10% | 13.11% |
| Return on Assets | 1.84% | 4.30% | 7.01% |
| Margins: Net | 10.58% | 26.15% | 45.94% |
| EBIT Margin | 19.66% | 35.51% | 18.49% |
| EBITDA Margin | 57.36% | 72.79% | 59.04% |
| Gross Margin | 61.18% | 62.10% | 62.80% |
| Research & Development to Revenue | 0.00% | 0.00% | 0.00% |
Camden's fundamental performance illustrates steady profitability with robust margins, underlining a well-managed operational framework conducive to sustaining dividend commitments.
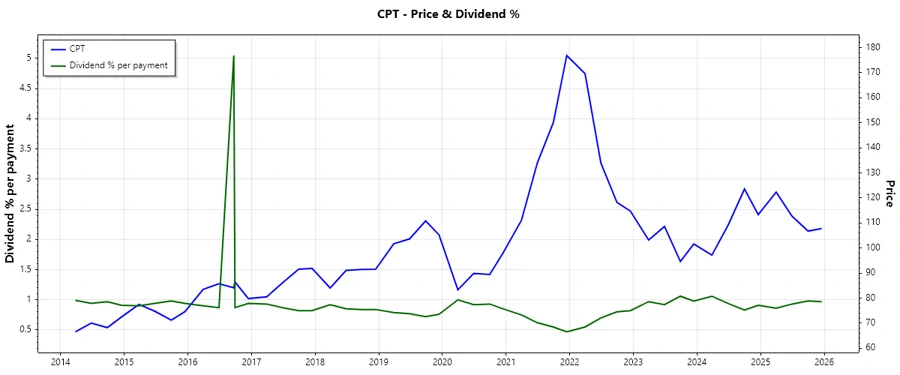
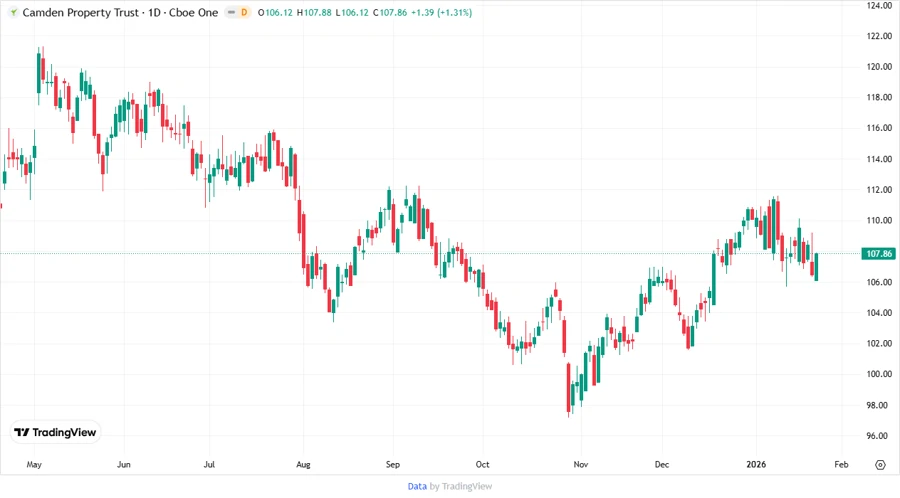
🔍 Price Development
📊 Dividend Scoring System
| Criteria | Score (1-5) | Score Bar |
|---|---|---|
| Dividend yield | 4 | |
| Dividend Stability | 5 | |
| Dividend growth | 3 | |
| Payout ratio | 2 | |
| Financial stability | 4 | |
| Dividend continuity | 5 | |
| Cashflow Coverage | 3 | |
| Balance Sheet Quality | 4 |
Total Score: 30 / 40
✨ Rating
In conclusion, Camden Property Trust is a strong contender for dividend-focused investors, offering a blend of yield, historical stability, and moderate growth prospects. While the high EPS payout ratio could pose challenges, the overall financial health remains robust, supporting ongoing income distribution. Investors looking for reliable dividend issuers in the Real Estate sector should consider Camden Property Trust for their portfolios.