September 05, 2025 a 12:47 pm


CPT: Dividend Analysis - Camden Property Trust
Camden Property Trust (CPT) has a robust dividend profile with a steady growth trajectory and a reliable history. Their impressive sector positioning as a Real Estate Investment Trust (REIT) indicates stable income potential, albeit with a high payout ratio. Investors should note the consistent yield and growth over the years.
Overview 📊
Camden Property Trust demonstrates strength in their dividend offering, marked by a consistent history of payouts without any recent cuts or suspensions, reflecting a level of reliability highly valued by dividend investors.
| Metric | Details |
|---|---|
| Sector | Real Estate |
| Dividend yield | 3.69% |
| Current dividend per share | 4.16 USD |
| Dividend history | 33 years |
| Last cut or suspension | None |
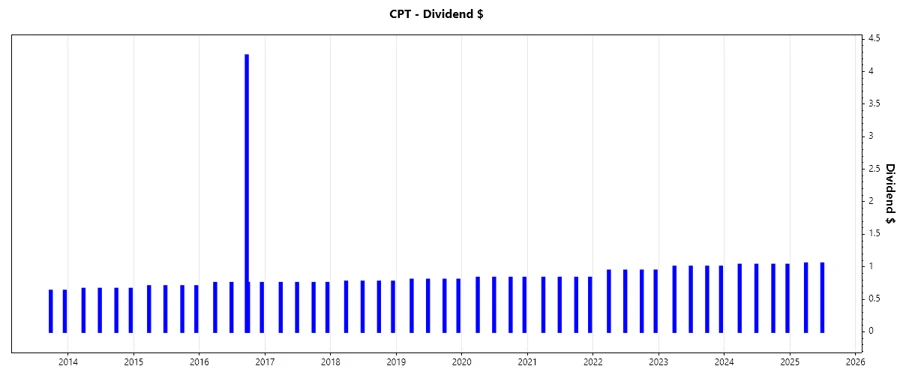
Dividend History 📉
The dividend history highlights Camden's commitment to returning value to shareholders over the decades. Their longstanding record suggests a management team committed to investor returns, even through economic downturns.
| Year | Dividend per Share (USD) |
|---|---|
| 2025 | 2.10 |
| 2024 | 4.12 |
| 2023 | 4.00 |
| 2022 | 3.76 |
| 2021 | 3.32 |
Dividend Growth 📈
The growth rate of dividends is a vital indicator of the company's potential for income growth over time. Camden shows a moderate yet consistent growth trajectory.
| Time | Growth |
|---|---|
| 3 years | 7.46% |
| 5 years | 5.18% |
The average dividend growth is 5.18% over 5 years. This shows moderate but steady dividend growth.
Payout Ratio 🗣️
A company's payout ratio is essential for understanding the sustainability of its dividend. Camden's EPS-based payout ratio reveals high pressure on net earnings to meet dividend obligations, which may limit flexibility.
| Key figure | Ratio |
|---|---|
| EPS-based | 289.51% |
| Free cash flow-based | 107.20% |
The payout ratio of 289.51% (EPS) and 107.20% (FCF) suggests a potential risk in sustaining the current dividend if earnings falter.
Cashflow & Capital Efficiency 💸
The ability of a company to generate cash and manage its capital efficiently underpins its dividend sustainability. Camden's positive cash flow yields and stable capital expenditure practices provide a reassuring backdrop for future dividend payments.
| Metric | 2024 | 2023 | 2022 |
|---|---|---|---|
| Free Cash Flow Yield | 3.03% | 3.56% | 2.45% |
| Earnings Yield | 1.30% | 3.74% | 5.43% |
| CAPEX to Operating Cash Flow | 47.74% | 51.69% | 60.35% |
| Stock-based Compensation to Revenue | 1.05% | 0.94% | 0.90% |
| Free Cash Flow / Operating Cash Flow Ratio | 49.19% | 48.31% | 39.65% |
The cash flow and capital efficiency metrics reflect a company with a generally strong cash generation ability, essential for ongoing dividend payouts.
Balance Sheet & Leverage Analysis 📖
Sufficient balance sheet health supports a company's ability to weather financial storms and continue paying dividends. Camden's leverage ratios are in check, indicating balanced debt levels relative to its equity and assets.
| Metric | 2024 | 2023 | 2022 |
|---|---|---|---|
| Debt-to-Equity | 74.55% | 74.60% | 73.82% |
| Debt-to-Assets | 39.38% | 39.59% | 39.46% |
| Debt-to-Capital | 42.71% | 42.72% | 42.47% |
| Net Debt to EBITDA | N/A | 3.08 | 4.37 |
| Current Ratio | N/A | 0.29 | 0.08 |
| Quick Ratio | 10.12% | 28.88% | 7.50% |
| Financial Leverage | 1.89 | 1.88 | 1.87 |
Camden maintains a strong balance sheet with healthy leverage ratios, providing flexibility for continued dividend growth and financial stability.
Fundamental Strength & Profitability 🔍
Fundamental metrics, like return on equity and asset margins, offer insight into a company's operational efficiency and profitability. Camden's returns and margins reveal a generally healthy and efficient operation.
| Year | ROE | ROA | Net Margin | EBIT Margin | EBITDA Margin | Gross Margin | R&D to Revenue |
|---|---|---|---|---|---|---|---|
| 2024 | 3.49% | 1.84% | 10.58% | 19.66% | 57.36% | 61.18% | N/A |
| 2023 | 8.10% | 4.30% | 26.15% | 35.51% | 72.79% | 62.11% | N/A |
| 2022 | 13.11% | 7.01% | 45.94% | 18.49% | 59.04% | 62.80% | N/A |
The strong profitability metrics indicate that Camden is well-positioned to continue generating significant returns over their asset base, supporting robust dividend payments.
Price Development 📈
Dividend Scoring System ⚖️
Our unique scoring system evaluates Camden Property Trust's dividend attributes across several crucial factors, culminating in a comprehensive dividend score.
| Category | Score | Score Bar |
|---|---|---|
| Dividend yield | 4 | |
| Dividend Stability | 5 | |
| Dividend growth | 3 | |
| Payout ratio | 2 | |
| Financial stability | 4 | |
| Dividend continuity | 5 | |
| Cashflow Coverage | 3 | |
| Balance Sheet Quality | 4 |
Overall Score: 35/40
Rating 🌟
Camden Property Trust maintains a robust dividend offering, characterized by a long-standing history of payments and recent steady growth rates. However, the high payout ratios indicate potential risks. Overall, Camden is a solid choice for income-focused investors seeking stability.