October 19, 2025 a 04:03 am


CPB: Trend and Support & Resistance Analysis - Campbell Soup Company
The Campbell Soup Company, a staple in the food and beverage market, has shown noticeable shifts in stock performance. The recent data suggests a potential trend and key price zones which investors should monitor closely. Understanding these changes can provide insights into suitable strategies for those looking to engage with CPB shares.
Trend Analysis
| Date | Closing Price | Trend |
|---|---|---|
| 2025-10-17 | $30.86 | ▼ Downtrend |
| 2025-10-16 | $30.71 | ▼ Downtrend |
| 2025-10-15 | $30.15 | ▼ Downtrend |
| 2025-10-14 | $30.34 | ▼ Downtrend |
| 2025-10-13 | $29.80 | ▼ Downtrend |
| 2025-10-10 | $30.39 | ▼ Downtrend |
| 2025-10-09 | $29.89 | ▼ Downtrend |
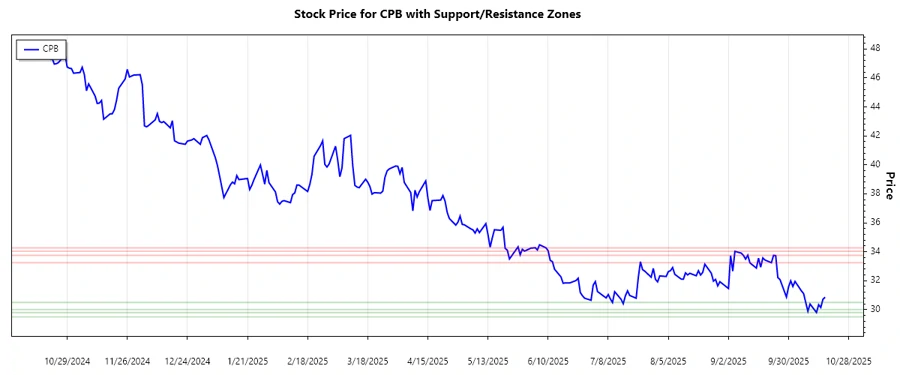
Currently, CPB is experiencing a ▼ Downtrend. The EMA20 is below the EMA50, indicating continued downward momentum. Investors may need to be cautious and should consider market movements before making any decisions.
Support and Resistance
| Zone | Range |
|---|---|
| Resistance Zone 1 | $33.24 ⇑ $33.75 |
| Resistance Zone 2 | $34.03 ⇑ $34.27 |
| Support Zone 1 | $30.00 ⇓ $30.50 |
| Support Zone 2 | $29.50 ⇓ $29.80 |
The current price hovers around the Support Zone 1, suggesting a potential rebound or further decline depending on market conditions. Investors should watch these levels closely for potential buying or selling opportunities.
Conclusion
The ongoing ▼ Downtrend of Campbell Soup Company stock suggests a cautious approach for investors. Current support zones may offer buying opportunities, while resistance levels could serve as sell targets if a reversal occurs. Monitoring these levels and trend indicators can aid in making informed trading decisions. The stock’s performance might be influenced by broader market trends and company-specific news. Continued analysis could reveal further insights into potential future movements.
Smart Data Insight
Master the Perfect Entry & Exit for this Stock
Don't leave your profits to chance. Historically, this stock follows specific seasonal patterns that institutional traders use to maximize returns.
- ✅ Identify the "Golden Buying Window"
- ✅ Avoid high-risk correction cycles
- ✅ Backtested data from the last 20+ years