March 23, 2026 a 03:15 pm
CPB: Fibonacci Analysis - Campbell Soup Company
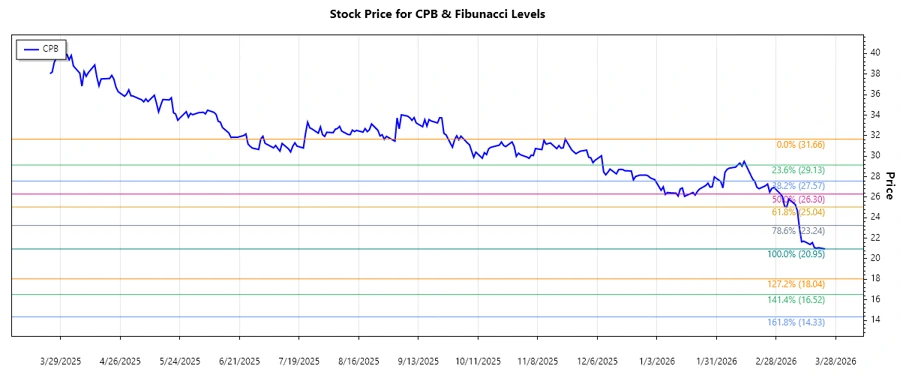
The Campbell Soup Company, renowned for its vast range of food and beverage products, has seen varied market movements. Given its established markets and brand recognition, CPB is a focal point for many investors. Recent trends have shown a decrease in its stock price, indicating potential considerations for strategic positioning. Analyzing this stock through Fibonacci retracements provides insights into possible future price levels.
Fibonacci Analysis
| Data | Detail |
|---|---|
| Trend Start Date | 2025-11-21 |
| Trend End Date | 2026-03-23 |
| High Point | $31.66 (2025-11-21) |
| Low Point | $20.95 (2026-03-23) |
| Fibonacci Level 0.236 | $23.79 |
| Fibonacci Level 0.382 | $25.53 |
| Fibonacci Level 0.5 | $26.31 |
| Fibonacci Level 0.618 | $27.09 |
| Fibonacci Level 0.786 | $28.27 |
| Current Price | $21.07 |
| Current Retracement Zone | Below 0.236 |
| Technical Interpretation | The current price is below the 0.236 Fibonacci level, indicating a strong potential downward momentum. Investors might see this as a bearish sign unless a reversal occurs. |
Conclusion
The Campbell Soup Company stock has been on a noticeable downward trajectory, with significant resistance expected at Fibonacci levels, especially around the $27-$28 range. Traders might await price behavior around these levels for potential buy-in opportunities. However, if the stock fails to breach upper retracement levels, further depreciation might be on the cards. Analysts will be keenly observing volume and market sentiment for any reversal signals.