March 17, 2026 a 11:44 am
CPB: Fibonacci Analysis - Campbell Soup Company
Campbell Soup Company has experienced a significant downward trend over the last several months. Known for its diverse portfolio in the food and beverage industry, CPB has been facing challenges that affect its stock performance. This analysis will explore the recent price movements and offer insights into potential support and resistance levels using Fibonacci retracement.
Fibonacci Analysis
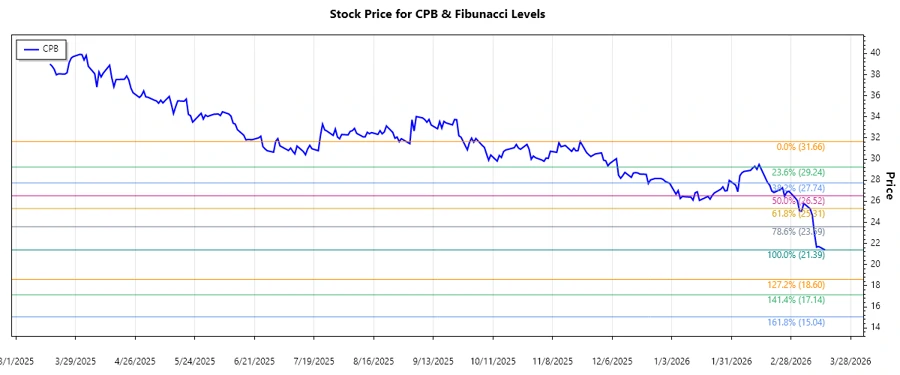
The Campbell Soup Company (CPB) has been trending downward since the high point recorded in November 2025. Using this trend, we conduct a Fibonacci retracement analysis to identify key levels that might influence future price movements.
| Analysis Parameter | Details |
|---|---|
| Start Date | 2025-11-21 |
| End Date | 2026-03-16 |
| High Point (Price/Date) | $31.66 / 2025-11-21 |
| Low Point (Price/Date) | $21.39 / 2026-03-16 |
| Fibonacci Level | Price Level |
|---|---|
| 0.236 | $23.66 |
| 0.382 | $25.17 |
| 0.5 | $26.52 |
| 0.618 | $27.88 |
| 0.786 | $29.92 |
As of the most recent data, the current price is within the 0.236 retracement zone. This indicates potential support at this level, which may serve as a buying opportunity if sustained.
The analysis suggests that if the current price can sustain above the 0.236 level, it could signal the potential for ascending back towards higher retracement levels, implying resistance and potential reversal trends.
Conclusion
The Campbell Soup Company is currently experiencing a downward trend, reflecting broader challenges within its industry segment. While there may be short-term risks contingent upon external factors, the presence of Fibonnaci support levels indicates potential buying areas. Analysts should watch for a reversal at the current 0.236 level, which could trigger upward momentum. However, sustained trading below this level may predict further declines to new interim lows. Overall, while there are risks associated with CPB's volatility, the stock could offer significant upside should market conditions stabilize, and the company capitalizes on any positive catalysts.