October 28, 2025 a 11:44 am

CPB: Fibonacci Analysis - Campbell Soup Company
The Campbell Soup Company stock has demonstrated a downward trend in recent months. Investors should note the significant drop from its high in early 2024, which could suggest continued volatility in the coming months. However, as a company with a robust product line, it still holds potential for recovery given favorable market conditions. Notably, its snack and beverage segments could act as key growth drivers to counterbalance the downturn.
Fibonacci Analysis
| Parameter | Details |
|---|---|
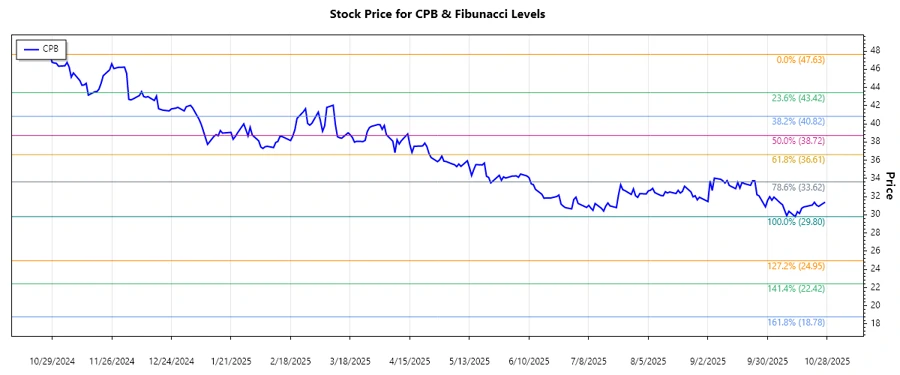
| Start Date of Trend | 2024-10-28 |
| End Date of Trend | 2025-10-27 |
| High Price & Date | $47.63 on 2024-10-28 |
| Low Price & Date | $29.8 on 2025-10-13 |
| Fibonacci Levels |
|
| Current Price (2025-10-27) | $31.39 |
| Retracement Zone | None |
| Technical Interpretation | The current price is below the 0.236 retracement level, indicating that the stock is struggling to recover from its significant decline. This could signal a strong resistance at higher levels unless there is a positive fundamental catalyst. |
Conclusion
Campbell Soup Company faces a challenging market environment with its recent downtrend. The stock's current position below the 0.236 Fibonacci retracement level suggests resistance at regaining ground lost since late 2024. However, its strong brand presence and diversified product offerings could support long-term recovery if the market environment becomes favorable. While the decline presents risks, the company's solid fundamentals provide potential upside for investors willing to endure short-term volatility. Analysts should monitor market conditions closely and look for signs of stabilization in the stock price to reassess entry points.
Smart Data Insight
Master the Perfect Entry & Exit for this Stock
Don't leave your profits to chance. Historically, this stock follows specific seasonal patterns that institutional traders use to maximize returns.
- ✅ Identify the "Golden Buying Window"
- ✅ Avoid high-risk correction cycles
- ✅ Backtested data from the last 20+ years