August 13, 2025 a 11:44 am
CPB: Fibonacci Analysis - Campbell Soup Company
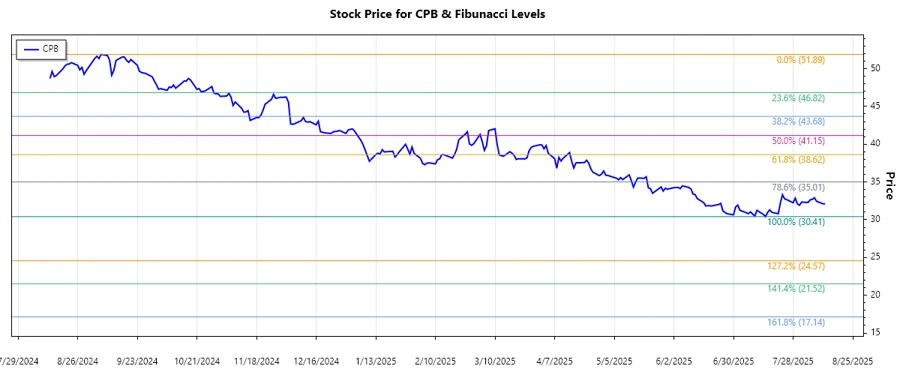
The Campbell Soup Company's stock, known for its resilience in the food and beverage industry, has shown significant movements in recent months. Through technical analysis, we observe a dominant downtrend in its stock price over the period reviewed. This analysis aims to understand potential price retracement levels which are crucial for decision-making in investment strategies. By examining Fibonacci retracement levels, we can identify potential support and resistance zones. Investors should be attentive to these technical insights to optimize their portfolio strategies.
Fibonacci Analysis
| Description | Value |
|---|---|
| Trend Start Date | 2024-09-09 |
| Trend End Date | 2025-08-12 |
| High Price (Date) | $51.89 (2024-09-06) |
| Low Price (Date) | $30.41 (2025-07-15) |
| Fibonacci Level 0.236 | $35.95 |
| Fibonacci Level 0.382 | $39.02 |
| Fibonacci Level 0.5 | $41.15 |
| Fibonacci Level 0.618 | $43.28 |
| Fibonacci Level 0.786 | $46.00 |
The current stock price of CPB is $32.1, which is in the retracement zone between the 0.236 and 0.382 levels. This suggests a short-term support level around the $36 price range, while a significant resistance may appear near $39.02, aligning with the 0.382 Fibonacci level.
Conclusion
As Campbell Soup Company continues navigating through a bearish trend, it remains crucial for analysts to watch the Fibonacci retracement areas for potential recovery signals. The technical analysis reveals both opportunities and constraints — a potential bounce-back could occur if the stock remains resilient around the identified support levels. However, breaking below these levels may warrant caution, signaling further downside risks. Investors should balance these technical insights with fundamental analysis to make more informed decisions.
Smart Data Insight
Master the Perfect Entry & Exit for this Stock
Don't leave your profits to chance. Historically, this stock follows specific seasonal patterns that institutional traders use to maximize returns.
- ✅ Identify the "Golden Buying Window"
- ✅ Avoid high-risk correction cycles
- ✅ Backtested data from the last 20+ years