
June 07, 2026 a 07:46 am

CPB: Dividend Analysis - Campbell Soup Company
Campbell Soup Company, a stalwart in the consumer goods sector, is renowned for its consistent dividend history spanning over four decades. With a current dividend yield of approximately 7.20%, CPB offers a lucrative opportunity for income-focused investors. The company's prudent financial management is evident in its stable payout ratios and a slight but consistent growth in dividends over recent years. Stakeholders may find the company's historical resilience and current attractive yield to be a compelling investment case, though the high payout ratio based on EPS warrants monitoring.
📊 Overview
In assessing Campbell Soup Company, it's significant to highlight the vital statistics that illustrate its standing in the industry. Strong historical dividend continuity and sector positioning complement its yield profile.
| Metric | Details |
|---|---|
| Sector | Consumer Goods |
| Dividend Yield | 7.20 % |
| Current Dividend Per Share | $1.54 USD |
| Dividend History | 43 years |
| Last Cut or Suspension | None |
🗣️ Dividend History
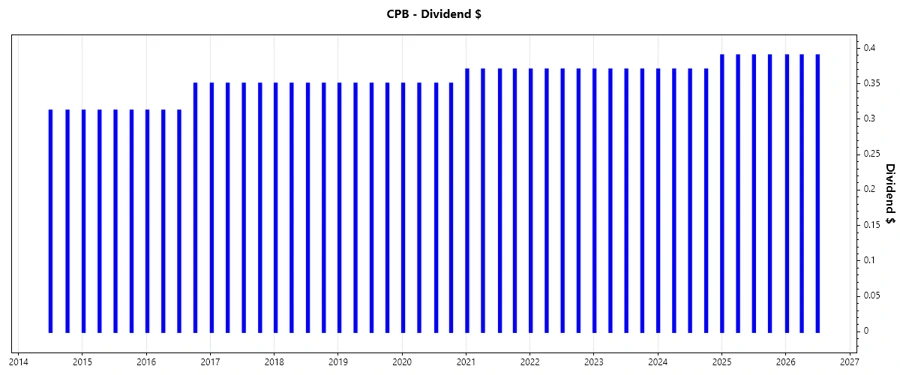
The strength of CPB's dividend history lies in its robust track record. Maintaining a steadfast commitment to shareholder returns, the company has shown resilience and consistency.
| Year | Dividend Per Share (USD) |
|---|---|
| 2026 | $1.17 |
| 2025 | $1.56 |
| 2024 | $1.48 |
| 2023 | $1.48 |
| 2022 | $1.48 |
📈 Dividend Growth
The growth trajectory of dividends is paramount for evaluating long-term value. Campbell's modest growth rates reflect its stable policy.
| Time | Growth |
|---|---|
| 3 years | 1.77 % |
| 5 years | 2.19 % |
The average dividend growth is 2.19% over 5 years. This shows moderate but steady dividend growth.
✅ Payout Ratio
Examining payout ratios offers insight into sustainability and potential stress points in the dividend policy.
| Key Figure | Ratio |
|---|---|
| EPS-based | 83.45 % |
| Free cash flow-based | 49.97 % |
The EPS-based payout ratio is high at 83.45%, indicating robust payments relative to earnings which might be unsustainable if earnings decline. FCF-based ratio is moderate at 49.97%, suggesting sufficient cash flow coverage.
Cashflow & Capital Efficiency
Understanding capital efficiency and cash flow stability is essential in gauging the company’s operational strength and potential for future dividend support.
| Year | 2025 | 2024 | 2023 |
|---|---|---|---|
| Free Cash Flow Yield | 7.33% | 4.75% | 5.64% |
| Earnings Yield | 6.26% | 4.03% | 6.26% |
| CAPEX to Operating Cash Flow | 18.96% | 43.63% | 32.37% |
| Stock-based Compensation to Revenue | 0.54% | 1.03% | 0.67% |
| Free Cash Flow / Operating Cash Flow Ratio | 62.33% | 56.37% | 67.63% |
While free cash flow production is strong, the efficiency ratios depict carefully balanced capital allocation, crucial for sustaining corporate commitments and reinvestments.
Balance Sheet & Leverage Analysis
Comprehending the financial structure and leverage impacts the long-term financial stability and risk profile of the enterprise.
| Year | 2025 | 2024 | 2023 |
|---|---|---|---|
| Debt-to-Equity | 184.83% | 198.79% | 135.67% |
| Debt-to-Assets | 48.42% | 49.50% | 41.19% |
| Debt-to-Capital | 64.89% | 66.53% | 57.57% |
| Net Debt to EBITDA | 4.47 | 5.25 | 2.80 |
| Current Ratio | 1.01 | 0.61 | 0.93 |
| Quick Ratio | 0.28 | 0.22 | 0.35 |
| Financial Leverage | 3.82 | 4.02 | 3.29 |
Leverage ratios are higher than industry norms, indicating aggressive borrowing which could pose risks should market conditions tighten, despite known for reliable debt management.
Fundamental Strength & Profitability
Analyzing fundamental metrics helps in assessing the operational excellence and overall financial health of the company.
| Year | 2025 | 2024 | 2023 |
|---|---|---|---|
| Return on Equity | 15.43% | 14.94% | 23.44% |
| Return on Assets | 4.04% | 3.72% | 7.12% |
| Margins: Net | 5.87% | 5.88% | 9.17% |
| EBIT Margin | 11.13% | 10.44% | 14.06% |
| EBITDA Margin | 15.36% | 14.71% | 18.20% |
Profitability ratios reveal effective utilization of resources, although future profitability might be influenced by debt service demands and margin management.
Price Development
Dividend Scoring System
Evaluating key aspects of the dividend strategy aids in assessing the investment attractiveness of CPB's dividend policy.
| Criteria | Score | Score Bar |
|---|---|---|
| Dividend Yield | 4 | |
| Dividend Stability | 5 | |
| Dividend Growth | 3 | |
| Payout Ratio | 3 | |
| Financial Stability | 3 | |
| Dividend Continuity | 5 | |
| Cashflow Coverage | 4 | |
| Balance Sheet Quality | 3 |
Total Score: 30/40
🔍 Rating
With a commendable dividend yield and an impressive history of stability, CPB stands out in dividend reliability even amidst a challenging consumer goods landscape. Nonetheless, the relatively high payout ratio calls for cautious optimism. For committed income investors, CPB offers a viable addition, provided they remain vigilant regarding ongoing earnings capacity and market conditions.
Smart Data Insight
Master the Perfect Entry & Exit for this Stock
Don't leave your profits to chance. Historically, this stock follows specific seasonal patterns that institutional traders use to maximize returns.
- ✅ Identify the "Golden Buying Window"
- ✅ Avoid high-risk correction cycles
- ✅ Backtested data from the last 20+ years