
June 02, 2026 a 03:31 am
CPB: Dividend Analysis - Campbell Soup Company
Campbell Soup Company demonstrates a strong dividend profile, though potential investors should weigh its earnings coverage and leverage levels carefully. The company's stable historical dividend history and moderate yield offer both continuity and reliability. Its payout ratios suggest healthy cash flow management, but a close eye on future earnings is advisable for sustaining these dividends long-term.
📊 Overview
Campbell Soup Company operates in the Consumer Staples sector, offering a compelling dividend profile with a yield of 7.40%. Its commitment to dividends is evident in its impressive history, having consistently paid dividends for 43 years. Despite this, the company hasn't recently cut or suspended its dividends.
| Detail | Value |
|---|---|
| Sector | Consumer Staples |
| Dividend yield | 7.40% |
| Current dividend per share | 1.54 USD |
| Dividend history | 43 years |
| Last cut or suspension | None |
🗣️ Dividend History
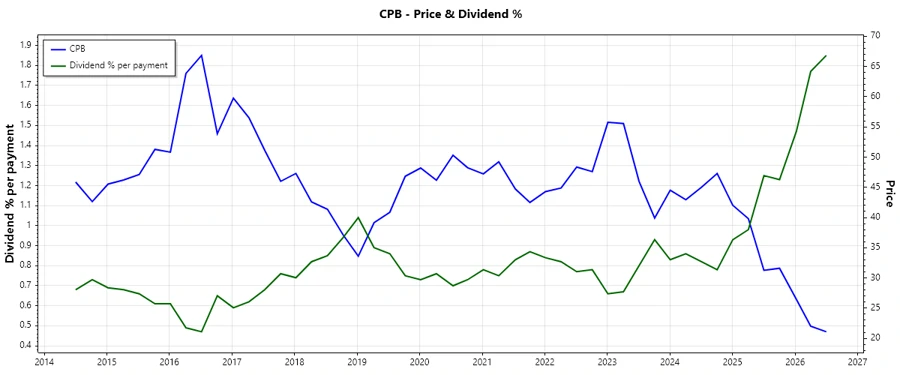
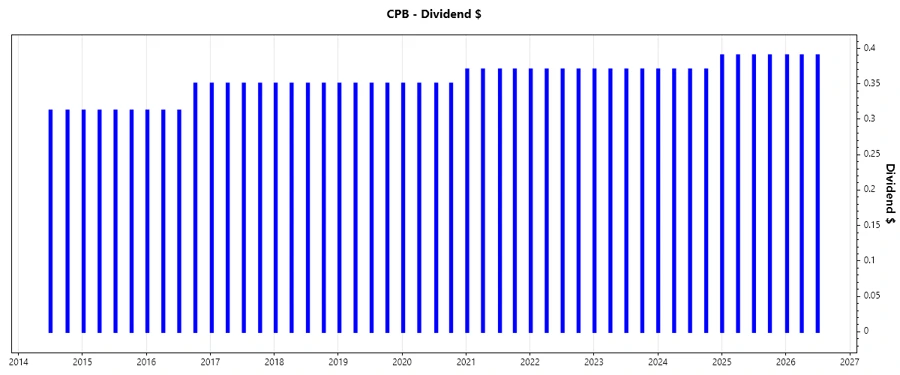
The company's extensive dividend history showcases its dedication to rewarding shareholders. This historical perspective is crucial as it helps predict the company's future dividend sustainability, providing a stable source of passive income for investors.
| Year | Dividend per share (USD) |
|---|---|
| 2026 | 1.17 |
| 2025 | 1.56 |
| 2024 | 1.48 |
| 2023 | 1.48 |
| 2022 | 1.48 |
📈 Dividend Growth
Examining dividend growth is essential for evaluating the company's potential to increase shareholder returns over time. While Campbell's modest growth rate of approximately 2.19% over five years might seem conservative, it provides a stable yet gradual increase in shareholder value.
| Time | Growth |
|---|---|
| 3 years | 1.77% |
| 5 years | 2.19% |
The average dividend growth is 2.19% over 5 years. This shows moderate but steady dividend growth.
✅ Payout Ratio
Payout ratios are vital indicators of dividend sustainability. The EPS payout ratio at 83.45% and FCF payout ratio at 49.97% suggest that while Campbell's dividends are well-covered by cash flow, its earnings payout ratio signals that future growth or slight adjustments might be necessary for sustainability.
| Key figure ratio | Value |
|---|---|
| EPS-based | 83.45% |
| Free cash flow-based | 49.97% |
The current ratios indicate high EPS payout but ample FCF coverage. This suggests careful cash flow management, though EPS margins leave less room for error.
📉 Cashflow & Capital Efficiency
A strong cash flow and capital efficiency are indicative of a company's capacity to sustain dividends and pursue growth. Let's delve into Campbell's cash management, operational efficiency, and capital allocation to understand its financial health.
| Year | 2025 | 2024 | 2023 |
|---|---|---|---|
| Free Cash Flow Yield | 7.33% | 4.75% | 5.64% |
| Earnings Yield | 6.26% | 4.03% | 6.26% |
| CAPEX to Operating Cash Flow | 18.96% | 43.63% | 32.37% |
| Stock-based Compensation to Revenue | 0.56% | 1.03% | 0.67% |
| Free Cash Flow / Operating Cash Flow Ratio | 62.33% | 56.37% | 67.63% |
The stability in cash flow and capital efficiency metrics highlight Campbell's strength in financial management, though higher CAPEX ratios may warrant further analysis of investment strategies.
⚠️ Balance Sheet & Leverage Analysis
Understanding the balance sheet and leverage metrics is crucial as they illustrate the company's ability to manage its debt and maintain liquidity, impacting its dividend-paying ability.
| Year | 2025 | 2024 | 2023 |
|---|---|---|---|
| Debt-to-Equity Ratio | 1.85 | 1.99 | 1.36 |
| Debt-to-Assets Ratio | 48.42% | 49.50% | 41.19% |
| Debt-to-Capital Ratio | 64.89% | 66.53% | 57.57% |
| Net Debt to EBITDA | 4.50 | 5.25 | 2.81 |
| Current Ratio | 0.77 | 0.61 | 0.93 |
| Quick Ratio | 0.28 | 0.22 | 0.35 |
| Financial Leverage | 3.82 | 4.02 | 3.29 |
Campbell's leverage levels underline a heavy debt burden; however, its adequate liquidity ratios and past performance reveal it's currently manageable with attention needed on debt structuring.
🏦 Fundamental Strength & Profitability
Assessing fundamental strength and profitability indicators such as margins and returns provides insight into the firm's operational efficiency and financial health, which are key to supporting ongoing dividend payments.
| Year | 2025 | 2024 | 2023 |
|---|---|---|---|
| Return on Equity | 15.43% | 14.94% | 23.44% |
| Return on Assets | 4.04% | 3.72% | 7.12% |
| Net Margin | 5.87% | 5.88% | 9.17% |
| EBIT Margin | 11.13% | 10.44% | 14.06% |
| EBITDA Margin | 15.36% | 14.71% | 18.20% |
| Gross Margin | 30.42% | 30.83% | 31.17% |
| R&D to Revenue | 0.98% | 0.83% | 0.98% |
While profitability ratios generally point towards an efficient operation, a declining margin trend could impact future profitability and dividend prospects if not reversed.
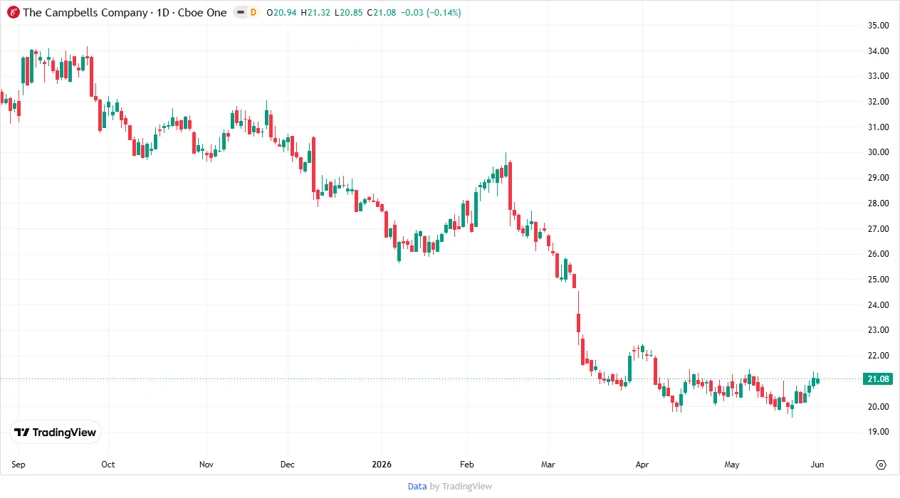
Price Development
🧐 Dividend Scoring System
| Category | Score | Rating |
|---|---|---|
| Dividend yield | 4 | |
| Dividend Stability | 5 | |
| Dividend growth | 3 | |
| Payout ratio | 3 | |
| Financial stability | 3 | |
| Dividend continuity | 5 | |
| Cashflow Coverage | 4 | |
| Balance Sheet Quality | 3 |
Overall Score: 30/40
📊 Rating
Based on the comprehensive assessment of Campbell Soup Company's dividend performance and financial health, the company presents itself as a reliable dividend payer with a long-standing history. However, prospective investors may wish to stay observant of any trends in margin compression and leverage that might affect future resilience and profitability.
Smart Data Insight
Master the Perfect Entry & Exit for this Stock
Don't leave your profits to chance. Historically, this stock follows specific seasonal patterns that institutional traders use to maximize returns.
- ✅ Identify the "Golden Buying Window"
- ✅ Avoid high-risk correction cycles
- ✅ Backtested data from the last 20+ years