May 13, 2026 a 07:31 am

CPB: Dividend Analysis - Campbell Soup Company
Campbell Soup Company, with its long-standing dividend history and a robust market presence, offers an attractive dividend yield of approximately 7.09%. This analysis delves into its dividend stability, growth potential, and overall financial health, providing insights into whether CPB is a viable option for dividend-focused investors.
📊 Overview
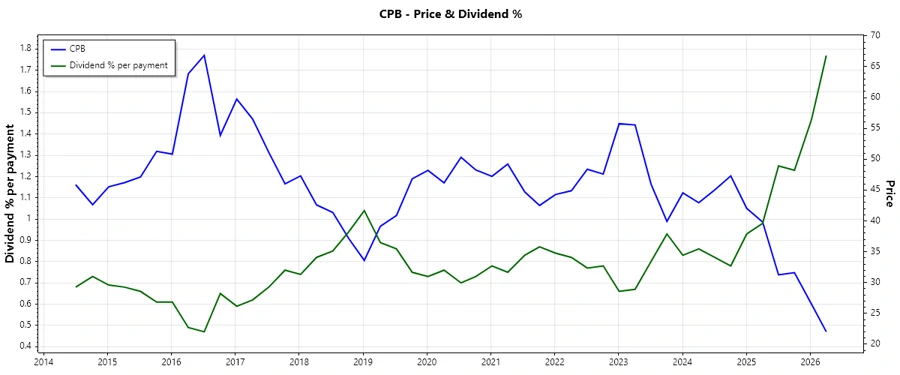
The Campbell Soup Company has sustained a consistent approach toward dividends over its history, presenting itself in the Consumer Staples sector. Its current dividend yield stands at a remarkable 7.09%, with a dividend per share of 1.54 USD. Impressively, the company maintains a 43-year history of dividend payments without any cuts or suspensions.
| Metric | Value |
|---|---|
| Sector | Consumer Staples |
| Dividend Yield | 7.09% |
| Current Dividend per Share | 1.54 USD |
| Dividend History | 43 years |
| Last Cut or Suspension | None |
🗣️ Dividend History
The historical trend of dividends is a testament to the company’s commitment to returning value to shareholders. Such history not only signifies trustworthiness but also attracts long-term investors. Its long-standing history without a cut reflects resilience and stability.
| Year | Dividend per Share (USD) |
|---|---|
| 2026 | 0.78 |
| 2025 | 1.56 |
| 2024 | 1.48 |
| 2023 | 1.48 |
| 2022 | 1.48 |
📈 Dividend Growth
Dividend growth is crucial for maintaining the purchasing power of received dividends against inflation. Campbell Soup Company's growth indicators, although modest, reflect a steady increase over the years, ensuring that shareholders potentially realize value appreciation.
| Time | Growth |
|---|---|
| 3 years | 0.02% |
| 5 years | 0.02% |
The average dividend growth is 0.02% over 5 years. This shows moderate but steady dividend growth.
📉 Payout Ratio
Understanding the payout ratio helps identify whether a company can maintain its current dividend levels. Campbell's EPS-based payout ratio of 83.45% suggests that a significant portion of earnings are returned as dividends. Meanwhile, the free cash flow-based payout ratio of 49.97% indicates a healthy cash flow situation to support its payouts.
| Key Figure | Ratio |
|---|---|
| EPS-based | 83.45% |
| Free Cash Flow-based | 49.97% |
The EPS payout ratio is relatively high, hinting at substantial earnings being returned to shareholders, while the free cash flow ratio shows a more balanced approach, allowing for flexibility.
Cashflow & Capital Efficiency
Examining cash flow metrics provides insights into financial efficiency and long-term sustainability. Campbell's cash flow yields and captive ratios suggest a prudent handling of operational funds.
| Year | 2025 | 2024 | 2023 |
|---|---|---|---|
| Free Cash Flow Yield | 7.33% | 4.75% | 5.64% |
| Earnings Yield | 6.26% | 4.03% | 6.26% |
| CAPEX to Operating Cash Flow | 37.67% | 43.63% | 32.37% |
| Stock Compensation to Revenue | 0.56% | 1.03% | 0.67% |
| Free Cash Flow / Operating Cash Flow Ratio | 62.33% | 56.37% | 67.63% |
The data indicates a reasonably efficient capital utilization with decent cash flow coverage relative to operations.
Balance Sheet & Leverage Analysis
Balance sheet analysis identifies how well a company can service its debts. Campbell's leverage ratios indicate moderate to high levels of indebtedness; however, solvency ratios provide assurance of its capabilities to meet obligations.
| Year | 2025 | 2024 | 2023 |
|---|---|---|---|
| Debt-to-Equity | 1.85 | 1.99 | 1.36 |
| Debt-to-Assets | 48.42% | 49.50% | 41.19% |
| Debt-to-Capital | 64.89% | 66.53% | 57.57% |
| Net Debt to EBITDA | 4.50 | 5.25 | 2.81 |
| Current Ratio | 0.77 | 0.61 | 0.93 |
The leverage indicators suggest caution as the figures depict higher financial leverage; however, the ability to generate earnings and cash flows to cover financial needs is evident.
Fundamental Strength & Profitability
Examining fundamental strengths, such as return on equity and asset margins, provides insights into profitability and operational effectiveness. Campbell shows stable profitability ratios across the years.
| Year | 2025 | 2024 | 2023 |
|---|---|---|---|
| Return on Equity | 15.43% | 14.94% | 23.44% |
| Return on Assets | 4.04% | 3.72% | 7.12% |
| Net Margin | 5.87% | 5.88% | 9.17% |
| EBIT Margin | 11.13% | 10.44% | 14.06% |
| Research & Development to Revenue | 0.98% | 1.06% | 0.98% |
Indicators demonstrate a consistent operating performance, ensuring stable profit margins over the years.
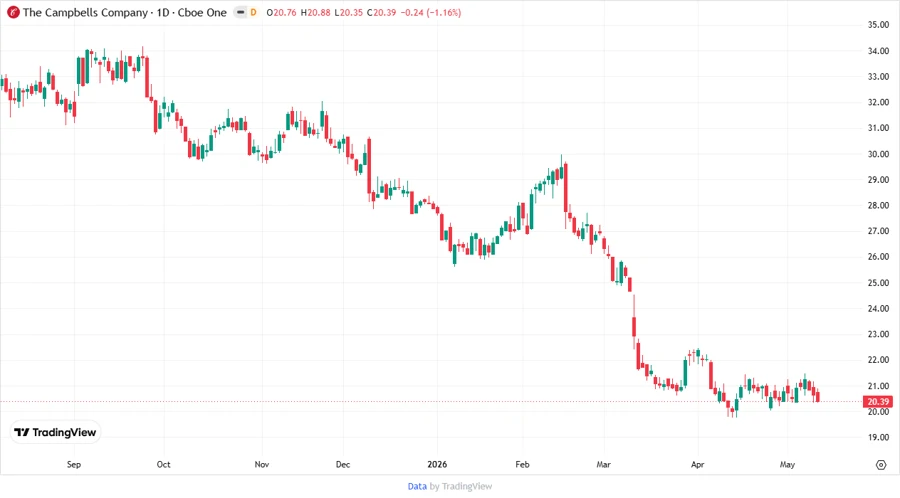
Price Development
✅ Dividend Scoring System
| Criteria | Score | Score Bar |
|---|---|---|
| Dividend yield | 3/5 | |
| Dividend Stability | 4/5 | |
| Dividend growth | 2/5 | |
| Payout ratio | 3/5 | |
| Financial stability | 3/5 | |
| Dividend continuity | 5/5 | |
| Cashflow Coverage | 4/5 | |
| Balance Sheet Quality | 3/5 |
Total Score: 27/40
⚠️ Rating
The Campbell Soup Company offers a decent yield and a sound history of dividend stability. However, investors should approach with moderated expectations about dividend growth. The overall rating is cautiously optimistic for income-focused portfolios, with the recommendation to closely monitor financial leverage and earnings growth.
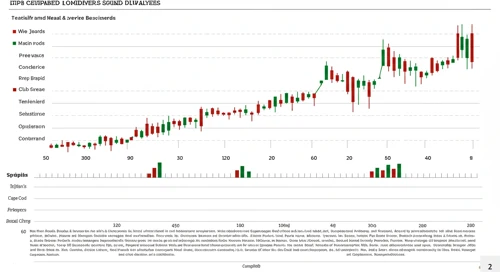
Smart Data Insight
Master the Perfect Entry & Exit for this Stock
Don't leave your profits to chance. Historically, this stock follows specific seasonal patterns that institutional traders use to maximize returns.
- ✅ Identify the "Golden Buying Window"
- ✅ Avoid high-risk correction cycles
- ✅ Backtested data from the last 20+ years