October 12, 2025 a 10:15 am
CPAY: Fibonacci Analysis - Corpay, Inc.
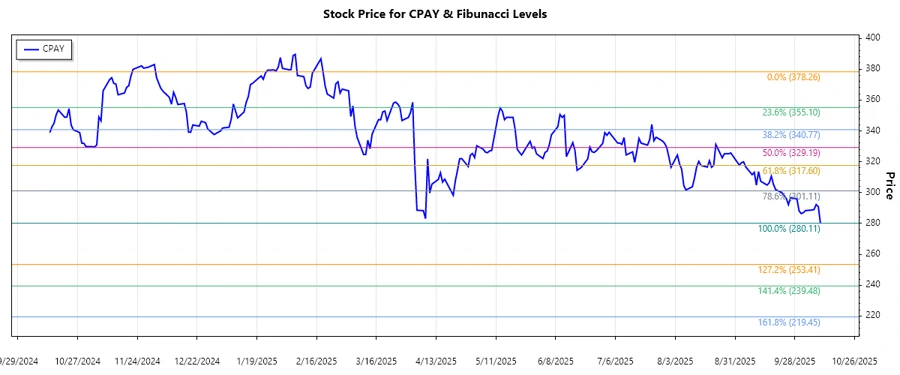
Corpay, Inc.'s stock has recently shown a predominant downward trend. The analysis focuses on technical factors to understand potential price reversal points using Fibonacci retracement levels, indicating opportunities for investors seeking to identify entry and exit points.
Fibonacci Analysis
| Detail | Value |
|---|---|
| Trend Start Date | 2025-02-20 |
| Trend End Date | 2025-10-10 |
| High Price & Date | $378.26 on 2025-02-19 |
| Low Price & Date | $280.11 on 2025-10-10 |
| Fibonacci 0.236 Level | $303.77 |
| Fibonacci 0.382 Level | $320.01 |
| Fibonacci 0.5 Level | $329.19 |
| Fibonacci 0.618 Level | $338.36 |
| Fibonacci 0.786 Level | $351.88 |
| Current Price | $280.11 |
| Retracement Zone | none |
| Interpretation | The current price remains below key retracement levels, indicating potential further downside or consolidation before a decisive trend change. |
Conclusion
The downward trend in Corpay, Inc.'s stock signals caution to investors as current prices remain below significant Fibonacci retracement levels. While this indicates potential risk, an opportunity might present itself if prices begin to recover and break above these key levels, suggesting a shift in trend. Until then, the stock may consolidate or continue its decline. Investors should monitor key signals, such as breaking the 0.382 and 0.5 retracement levels for a more definitive trend reversal. The fundamental outlook of Corpay, Inc. should also be considered, as the company's payment solutions remain broadly adopted worldwide.
Smart Data Insight
Master the Perfect Entry & Exit for this Stock
Don't leave your profits to chance. Historically, this stock follows specific seasonal patterns that institutional traders use to maximize returns.
- ✅ Identify the "Golden Buying Window"
- ✅ Avoid high-risk correction cycles
- ✅ Backtested data from the last 20+ years